Question
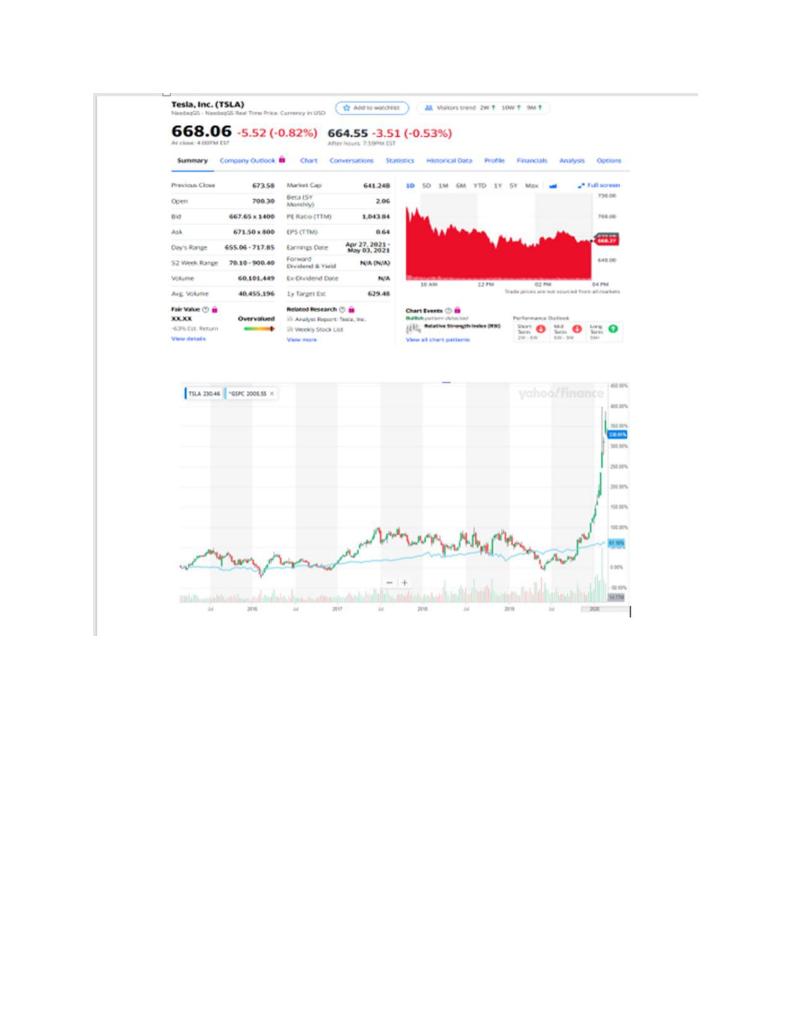
Look at the picture comparing the 5 year returns for Tesla (TSLA) and S&P 500 (^GSPC). It's obvious that the return volatility (i.e. standard deviation
Look at the picture comparing the 5 year returns for Tesla (TSLA) and S&P 500 (^GSPC). It's obvious that the return volatility (i.e. standard deviation of returns) of Tesla stock is at least 5-10 times greater than that of S&P 500 (the blue line). Yet, if you look up Tesla's 5 year beta (on the summary page of Yahoo Finance (Links to an external site.)), it is only around 2 suggesting that TSLA is only twice as volatile as the market (represented by S&P500 index).
How do you explain this discrepancy between what standard deviation tells you (that TSLA is 5 to 10 times more volatile than the market) and what beta tells you (that the stock is about twice as risky as the overall market (SP500))?
TSLA vs SP500.PNG

Step by Step Solution
There are 3 Steps involved in it
Step: 1

Get Instant Access to Expert-Tailored Solutions
See step-by-step solutions with expert insights and AI powered tools for academic success
Step: 2

Step: 3

Ace Your Homework with AI
Get the answers you need in no time with our AI-driven, step-by-step assistance
Get Started


