Answered step by step
Verified Expert Solution
Question
1 Approved Answer
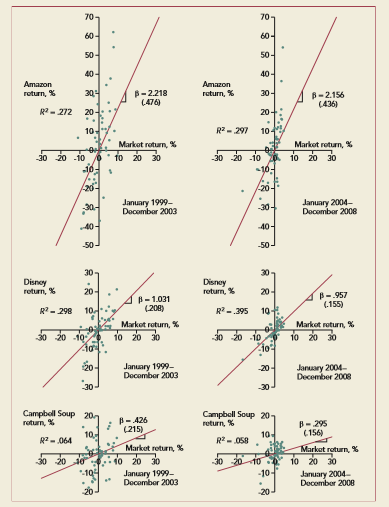
Look back to the top-right panel of Figure 9.2 . What proportion of Amazons returns was explained by market movements? What proportion of risk was
Look back to the top-right panel of Figure 9.2 . What proportion of Amazons returns was explained by market movements? What proportion of risk was diversifiable? How does the diversifiable risk show up in the plot? What is the range of possible errors in the estimated beta?

Amazon run, % -2218 Atim, % -2156 R 272 20 R-297 10 Market ntun % Market return, % 30 20 -10 20 30 30 20 -10 10 20 30 January 1999- Decombor 2003 January 2004- Decombor 2008 Disney return % Disnay otun % -.957 R2-298 R2-395 1Q Market Rturn, % January 1999- Decombor 2003 Campbell Soup 20 return, % return % -.426 -Markot return, % return, % 10 20 30
Step by Step Solution
There are 3 Steps involved in it
Step: 1

Get Instant Access to Expert-Tailored Solutions
See step-by-step solutions with expert insights and AI powered tools for academic success
Step: 2

Step: 3

Ace Your Homework with AI
Get the answers you need in no time with our AI-driven, step-by-step assistance
Get Started


