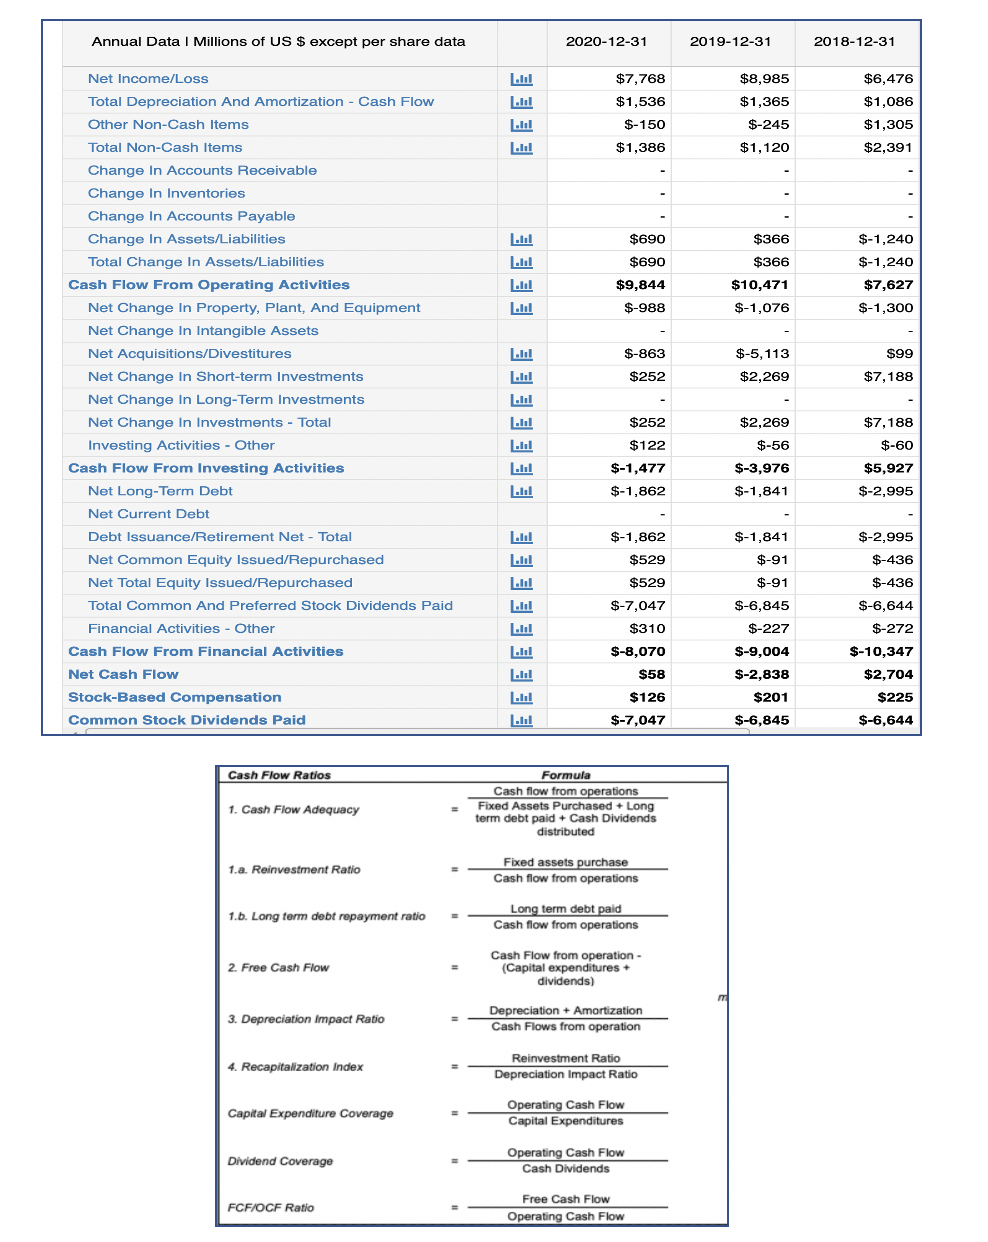
Look for the following years 2018, 2019, 2020. (solve separately for the following years) with the given Statement of Cash flow above.
Compute the following separately for years 2018, 2019, 2020:
- Cash Flow Adequacy
- Reinvestment Ratio
- Long Term Debt Repayment Ratio
- Free Cash Flow
- Depreciation Impact Ratio
- Recapitalization Index
- Capital Expenditure Coverage
- Dividend Coverage
- FCF/OCF Ratio
Annual Data 1 Millions of US $ except per share data 2020-12-31 2019-12-31 2018-12-31 $7,768 $8,985 $1,365 lil Ill Ill $1,536 $-150 $6,476 $1,086 $1,305 $-245 $1,386 $1,120 $2,391 $690 $366 $-1,240 $-1,240 $690 $366 $9,844 $10,471 $7,627 $-1,300 $-988 $-1,076 $-863 $99 $-5,113 $2,269 $252 $7,188 Net Income/Loss Total Depreciation And Amortization - Cash Flow Other Non-Cash Items Total Non-Cash Items Change In Accounts Receivable Change In Inventories Change In Accounts Payable Change In Assets/Liabilities Total Change In Assets/Liabilities Cash Flow From Operating Activities Net Change In Property, Plant, And Equipment Net Change In Intangible Assets Net Acquisitions/Divestitures Net Change In Short-term Investments Net Change In Long-Term Investments Net Change In Investments - Total Investing Activities - Other Cash Flow From Investing Activities Net Long-Term Debt Net Current Debt Debt Issuance/Retirement Net - Total Net Common Equity Issued/Repurchased Net Total Equity Issued/Repurchased Total Common And Preferred Stock Dividends Paid Financial Activities - Other Cash Flow From Financial Activities Net Cash Flow Stock-Based Compensation Common Stock Dividends Paid lil $252 $7,188 EEEEEEEEEEEEEEEE $2,269 $-56 $122 $-60 $-1,477 $-1,862 $-3,976 $-1,841 $5,927 $-2,995 $-2,995 $-1,862 $529 $-1,841 $-91 $-436 $-91 $-436 $529 $-7,047 $310 $-6,644 LUI $-8,070 $-6,845 $-227 $-9,004 $-2,838 $201 $-272 $-10,347 $2,704 $58 $126 $225 | lil $-7,047 $-6,845 $-6,644 Cash Flow Ratios 1. Cash Flow Adequacy Formula Cash flow from operations Fixed Assets Purchased + Long term debt paid + Cash Dividends distributed 1.a. Reinvestment Ratio Fixed assets purchase Cash flow from operations 1.b. Long term debt repayment ratio Long term debt paid Cash flow from operations 2. Free Cash Flow Cash Flow from operation - (Capital expenditures + dividends) 3. Depreciation Impact Ratio Depreciation + Amortization Cash Flows from operation 4. Recapitalization Index Reinvestment Ratio Depreciation Impact Ratio Capital Expenditure Coverage Operating Cash Flow Capital Expenditures Dividend Coverage Operating Cash Flow Cash Dividends FCF/OCF Ratio Free Cash Flow Operating Cash Flow Annual Data 1 Millions of US $ except per share data 2020-12-31 2019-12-31 2018-12-31 $7,768 $8,985 $1,365 lil Ill Ill $1,536 $-150 $6,476 $1,086 $1,305 $-245 $1,386 $1,120 $2,391 $690 $366 $-1,240 $-1,240 $690 $366 $9,844 $10,471 $7,627 $-1,300 $-988 $-1,076 $-863 $99 $-5,113 $2,269 $252 $7,188 Net Income/Loss Total Depreciation And Amortization - Cash Flow Other Non-Cash Items Total Non-Cash Items Change In Accounts Receivable Change In Inventories Change In Accounts Payable Change In Assets/Liabilities Total Change In Assets/Liabilities Cash Flow From Operating Activities Net Change In Property, Plant, And Equipment Net Change In Intangible Assets Net Acquisitions/Divestitures Net Change In Short-term Investments Net Change In Long-Term Investments Net Change In Investments - Total Investing Activities - Other Cash Flow From Investing Activities Net Long-Term Debt Net Current Debt Debt Issuance/Retirement Net - Total Net Common Equity Issued/Repurchased Net Total Equity Issued/Repurchased Total Common And Preferred Stock Dividends Paid Financial Activities - Other Cash Flow From Financial Activities Net Cash Flow Stock-Based Compensation Common Stock Dividends Paid lil $252 $7,188 EEEEEEEEEEEEEEEE $2,269 $-56 $122 $-60 $-1,477 $-1,862 $-3,976 $-1,841 $5,927 $-2,995 $-2,995 $-1,862 $529 $-1,841 $-91 $-436 $-91 $-436 $529 $-7,047 $310 $-6,644 LUI $-8,070 $-6,845 $-227 $-9,004 $-2,838 $201 $-272 $-10,347 $2,704 $58 $126 $225 | lil $-7,047 $-6,845 $-6,644 Cash Flow Ratios 1. Cash Flow Adequacy Formula Cash flow from operations Fixed Assets Purchased + Long term debt paid + Cash Dividends distributed 1.a. Reinvestment Ratio Fixed assets purchase Cash flow from operations 1.b. Long term debt repayment ratio Long term debt paid Cash flow from operations 2. Free Cash Flow Cash Flow from operation - (Capital expenditures + dividends) 3. Depreciation Impact Ratio Depreciation + Amortization Cash Flows from operation 4. Recapitalization Index Reinvestment Ratio Depreciation Impact Ratio Capital Expenditure Coverage Operating Cash Flow Capital Expenditures Dividend Coverage Operating Cash Flow Cash Dividends FCF/OCF Ratio Free Cash Flow Operating Cash Flow