Answered step by step
Verified Expert Solution
Question
1 Approved Answer
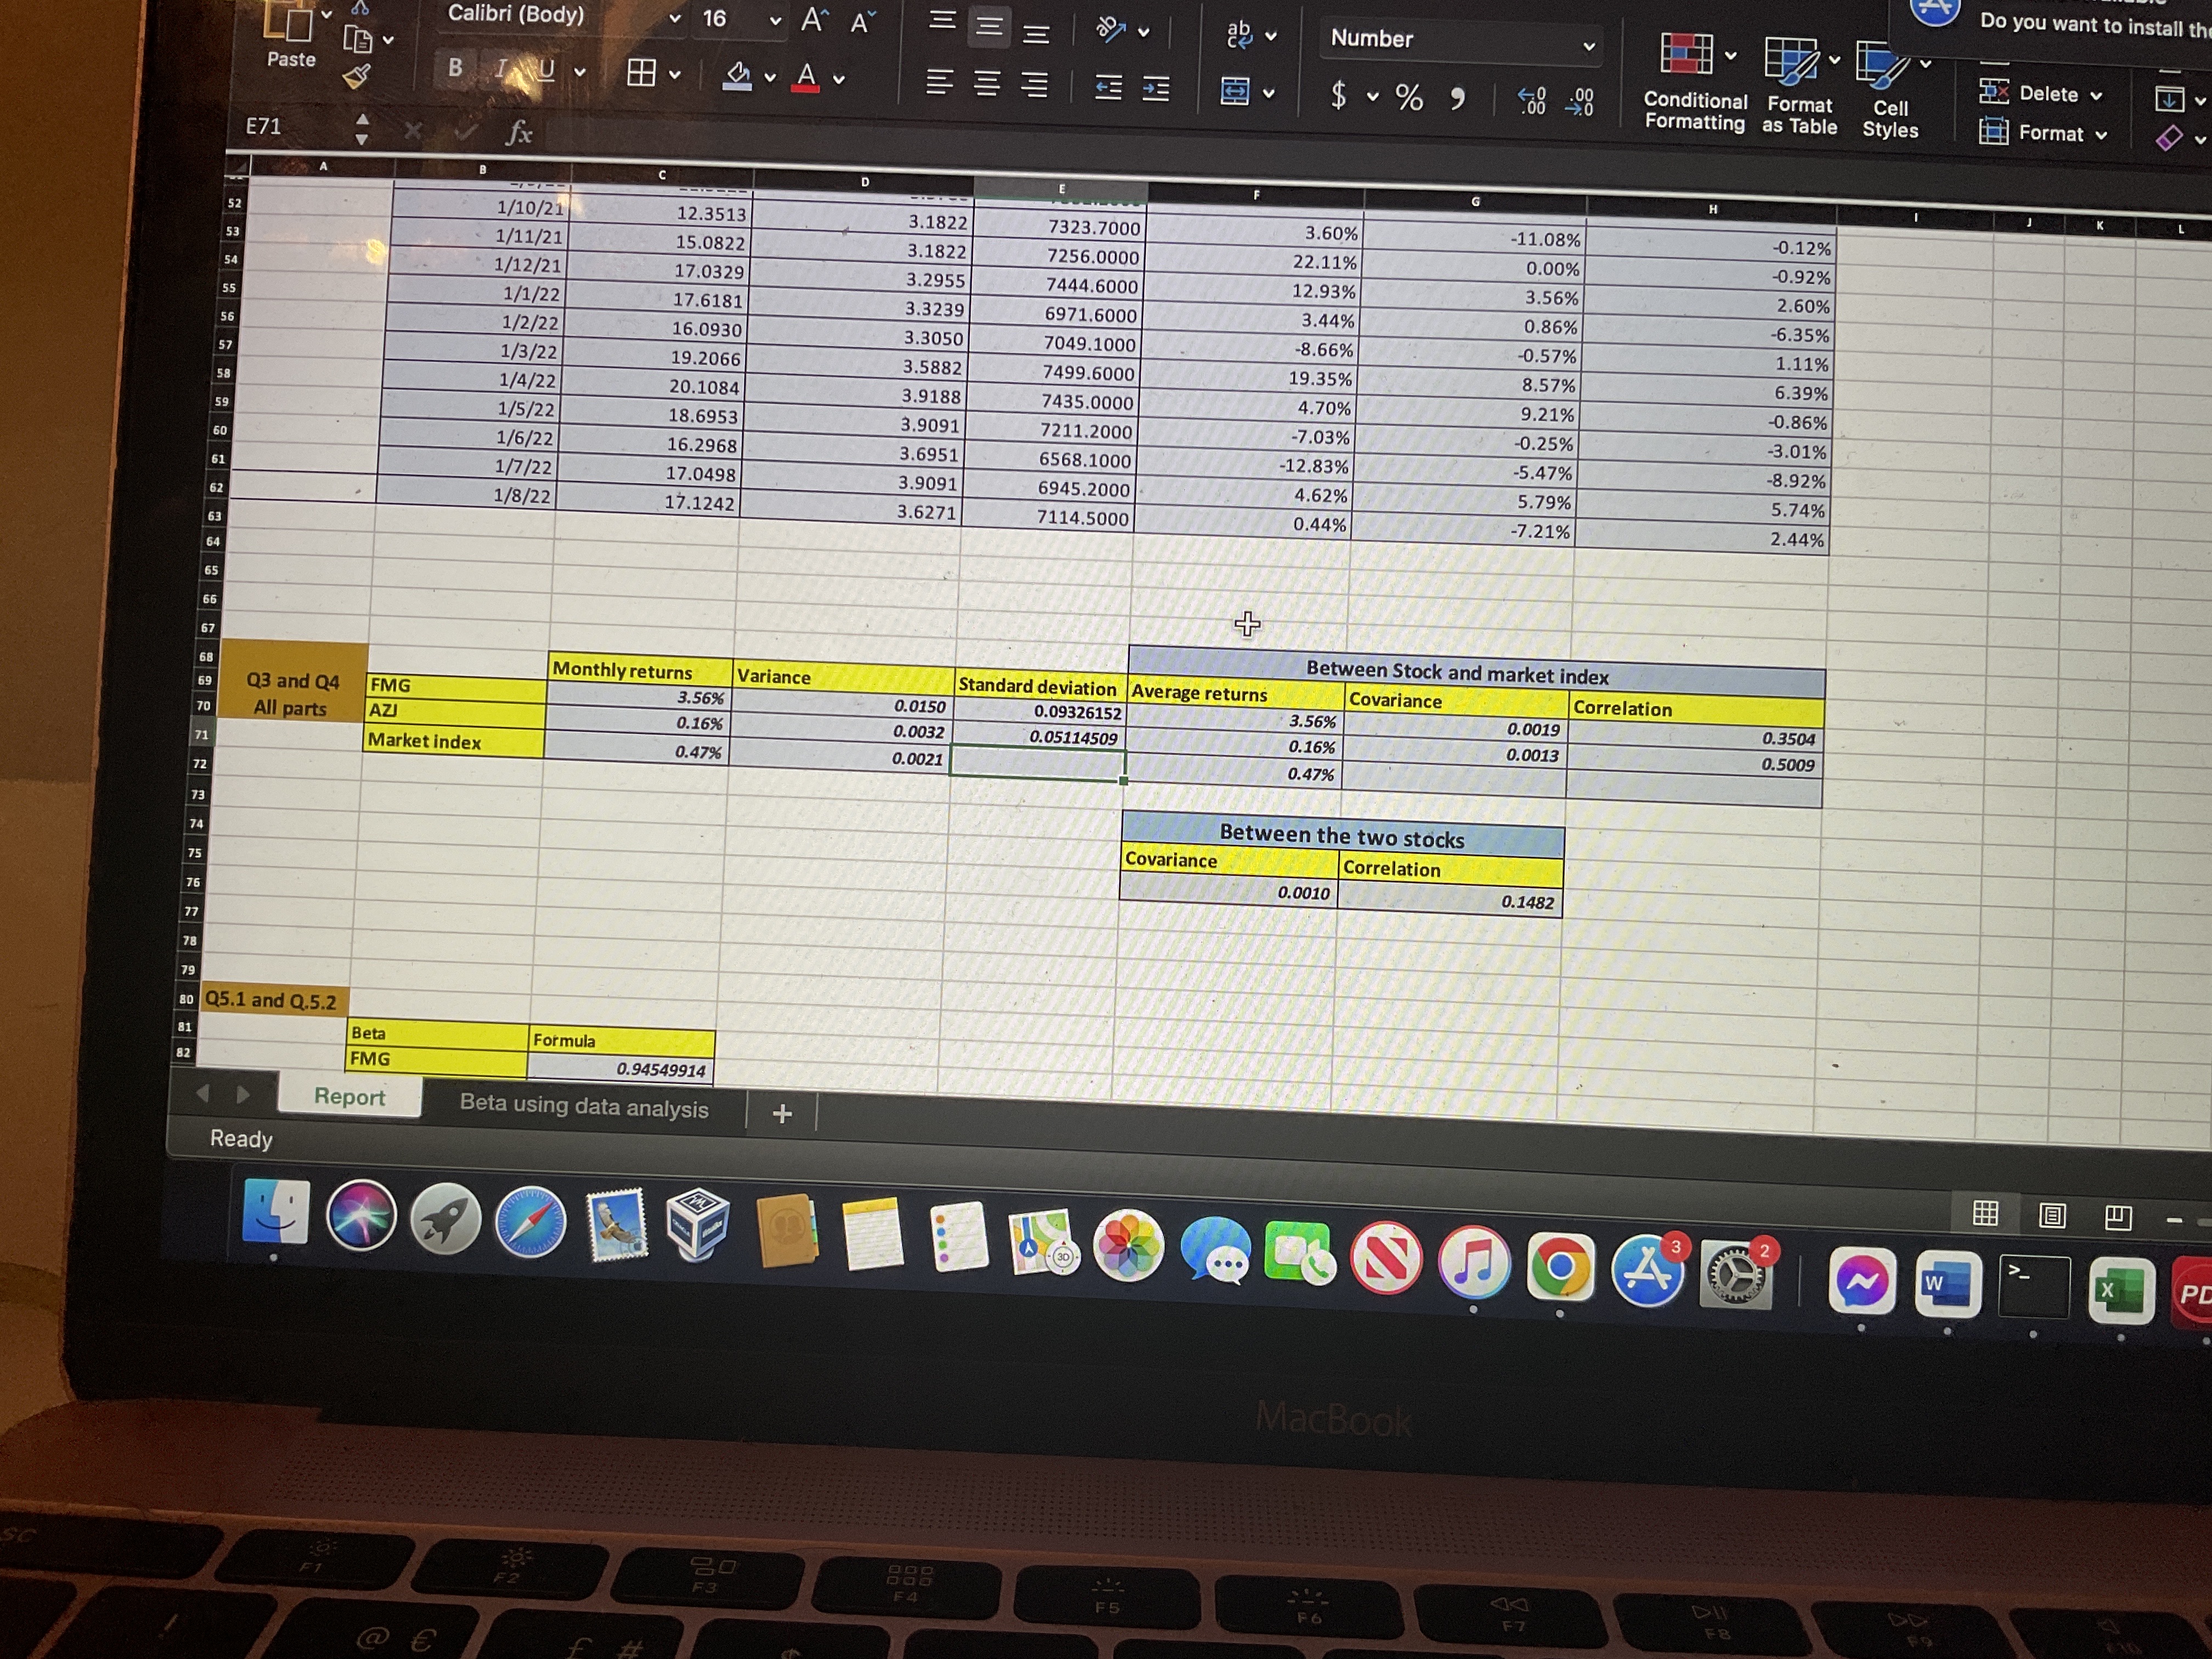
Looking at the average monthly return and standard deviation of your first stock, compute a 95% prediction interval and interpret your answer. 73 74 75
Looking at the average monthly return and standard deviation of your first stock, compute a 95% prediction interval and interpret your answer.

73 74 75 76 81 82 77 78 70 71 72 68 69 67 66 64 63 65 62 53 57 58 59 60 61 52 54 55 56 Paste E71 79 80 Q5.1 and Q.5.2 Q3 and Q4 All parts A Ready 7 F Beta FMG Report FMG Market index Calibri (Body) B IU B- fx @ B -1-1-- 1/10/21 1/11/21 1/12/21 1/1/22 1/2/22 1/3/22 1/4/22 1/5/22 1/6/22 1/7/22 1/8/22 V 383 F2 Formula O C V 16 Monthly returns 111-I f # 12.3513 15.0822 17.0329 17.6181 16.0930 19.2066 20.1084 18.6953 16.2968 17.0498 17.1242 Beta using data analysis 3.56% 0.16% 0.47% 0.94549914 Ch M F3 A^ A V Av Variance + D ||||||| = ---- 3.1822 3.1822 3.2955 3.3239 3.3050 3.5882 3.9188 3.9091 3.6951 3.9091 3.6271 0.0150 0.0032 0.0021 888 0000 | E 7323.7000 7256.0000 7444.6000 6971.6000 7049.1000 7499.6000 7435.0000 7211.2000 6568.1000 6945.2000 7114.5000 Standard deviation Average returns 0.09326152 0.05114509 30 F5 F Covariance Number $ % 9 3.60% 22.11% 12.93% 3.44% -8.66% 19.35% 4.70% -7.03% -12.83% 4.62% 0.44% 3.56% 0.16% 0.47% Between the two stocks Correlation 0.0010 Between Stock and market index Covariance F6 MacBook G 0.00 .00 .0 -11.08% 0.00% 3.56% 0.86% -0.57% 8.57% 9.21% -0.25% -5.47% 5.79% -7.21% 0.0019 0.0013 0.1482 Correlation Conditional Format Cell Formatting as Table Styles 3 A D H V DI WALATRACE 2 0.3504 0.5009 -0.12% -0.92% 2.60% -6.35% 1.11% 6.39% -0.86% -3.01% -8.92% 5.74% 2.44% Z W Do you want to install the Delete v Format v K X L < >
Step by Step Solution
★★★★★
3.31 Rating (172 Votes )
There are 3 Steps involved in it
Step: 1
Based on the data in the spreadsheet the average monthly return for the firs...
Get Instant Access to Expert-Tailored Solutions
See step-by-step solutions with expert insights and AI powered tools for academic success
Step: 2

Step: 3

Ace Your Homework with AI
Get the answers you need in no time with our AI-driven, step-by-step assistance
Get Started


