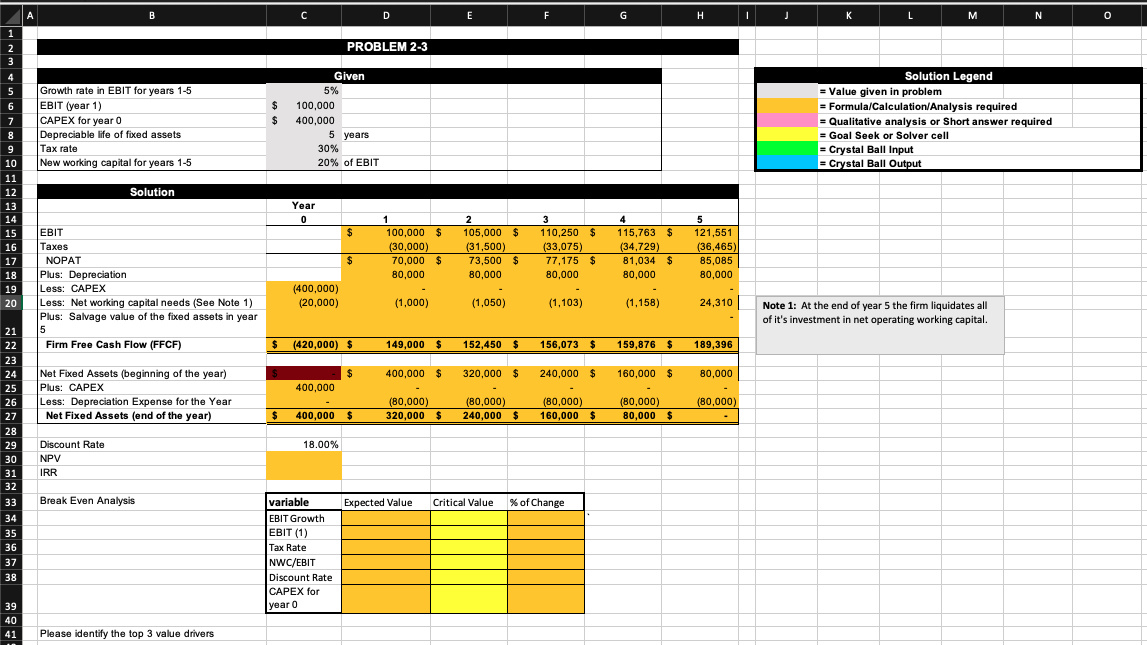
Looking for help with the formulas too!
A B C D E F G H I J K L M N 0 1 2 3 PROBLEM 2-3 4 5 6 $ $ Growth rate in EBIT for years 1-5 EBIT (year 1) CAPEX for year 0 Depreciable life of fixed assets Tax rate New working capital for years 1-5 Given 5% 100,000 400,000 5 years 30% 20% of EBIT Solution Legend = Value given in problem = Formula/Calculation/Analysis required = Qualitative analysis or Short answer required = Goal Seek or Solver cell = Crystal Ball Input = Crystal Ball Output Solution 7 8 9 10 11 12 13 14 15 16 17 18 19 20 Year 0 $ $ 1 1 100,000 $ (30,000) 70,000 $ 80,000 2 105,000 $ (31,500 73,500 $ 80,000 3 110,250 $ (33,075) 77,175 $ 80,000 4 115,763 $ (34,729) 81,034 $ 80,000 5 5 121,551 (36,465) 85,085 80,000 $ EBIT Taxes NOPAT Plus: Depreciation Less: CAPEX Less: Net working capital needs (See Note 1) Plus: Salvage value of the fixed assets in year 5 5 Firm Free Cash Flow (FFCF) (400,000) (20,000) (1,000) (1,050) (1,103) (1,158) 24,310 Note 1: At the end of year 5 the firm liquidates all of it's investment in net operating working capital. (420,000) $ 149,000 $ 152,450 $ 156,073 $ 159,876 $ 189,396 $ 400,000 $ 320,000 $ 240,000 $ 160,000 $ 80,000 400,000 Net Fixed Assets (beginning of the year) Plus: CAPEX Less: Depreciation Expense for the Year Net Fixed Assets (end of the year) (80.000) (80,000) (80,000) 240,000 $ (80,000) 80,000 $ $ 400,000 $ (80,000) 160,000 $ 320,000 $ 18.00% 21 22 23 24 25 26 27 28 29 30 31 32 33 34 35 36 37 38 Discount Rate NPV IRR Break Even Analysis Expected Value Critical Value % of Change variable EBIT Growth EBIT (1) Tax Rate NWC/EBIT Discount Rate CAPEX for year 0 39 40 41 Please identify the top 3 value drivers A B C D E F G H I J K L M N 0 1 2 3 PROBLEM 2-3 4 5 6 $ $ Growth rate in EBIT for years 1-5 EBIT (year 1) CAPEX for year 0 Depreciable life of fixed assets Tax rate New working capital for years 1-5 Given 5% 100,000 400,000 5 years 30% 20% of EBIT Solution Legend = Value given in problem = Formula/Calculation/Analysis required = Qualitative analysis or Short answer required = Goal Seek or Solver cell = Crystal Ball Input = Crystal Ball Output Solution 7 8 9 10 11 12 13 14 15 16 17 18 19 20 Year 0 $ $ 1 1 100,000 $ (30,000) 70,000 $ 80,000 2 105,000 $ (31,500 73,500 $ 80,000 3 110,250 $ (33,075) 77,175 $ 80,000 4 115,763 $ (34,729) 81,034 $ 80,000 5 5 121,551 (36,465) 85,085 80,000 $ EBIT Taxes NOPAT Plus: Depreciation Less: CAPEX Less: Net working capital needs (See Note 1) Plus: Salvage value of the fixed assets in year 5 5 Firm Free Cash Flow (FFCF) (400,000) (20,000) (1,000) (1,050) (1,103) (1,158) 24,310 Note 1: At the end of year 5 the firm liquidates all of it's investment in net operating working capital. (420,000) $ 149,000 $ 152,450 $ 156,073 $ 159,876 $ 189,396 $ 400,000 $ 320,000 $ 240,000 $ 160,000 $ 80,000 400,000 Net Fixed Assets (beginning of the year) Plus: CAPEX Less: Depreciation Expense for the Year Net Fixed Assets (end of the year) (80.000) (80,000) (80,000) 240,000 $ (80,000) 80,000 $ $ 400,000 $ (80,000) 160,000 $ 320,000 $ 18.00% 21 22 23 24 25 26 27 28 29 30 31 32 33 34 35 36 37 38 Discount Rate NPV IRR Break Even Analysis Expected Value Critical Value % of Change variable EBIT Growth EBIT (1) Tax Rate NWC/EBIT Discount Rate CAPEX for year 0 39 40 41 Please identify the top 3 value drivers


