 Looking for the calculations for the gray boxes. Thanks!
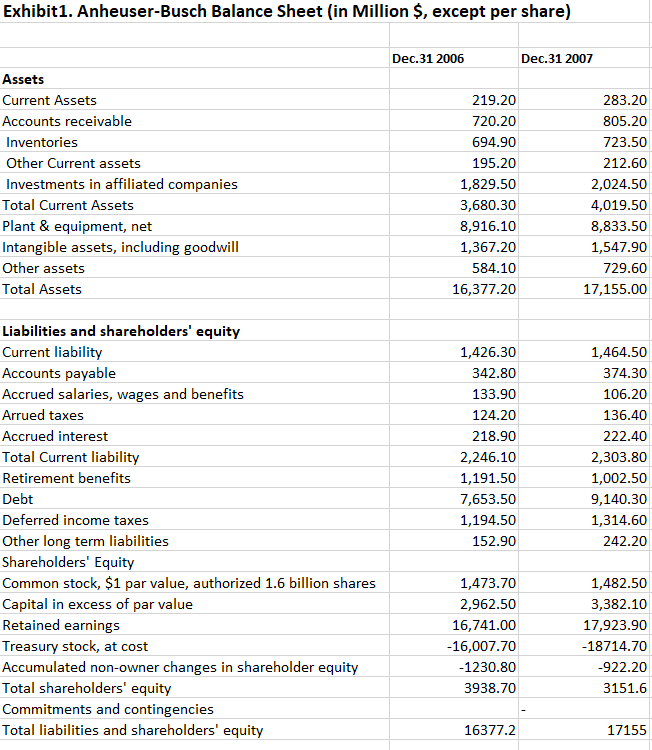
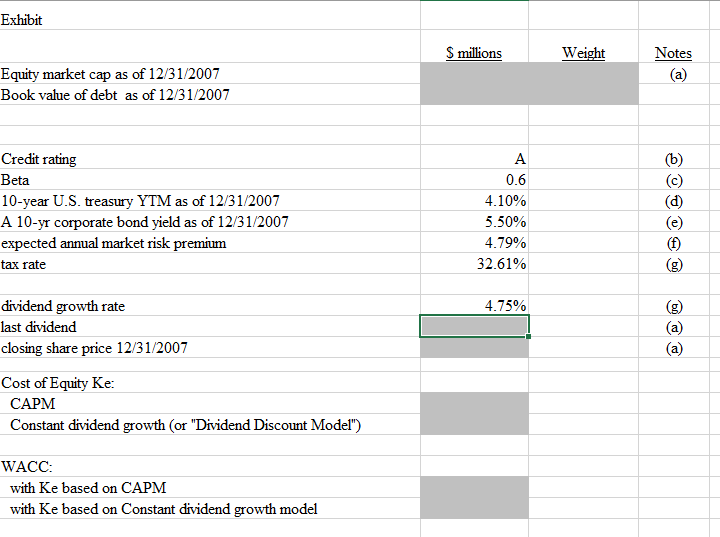
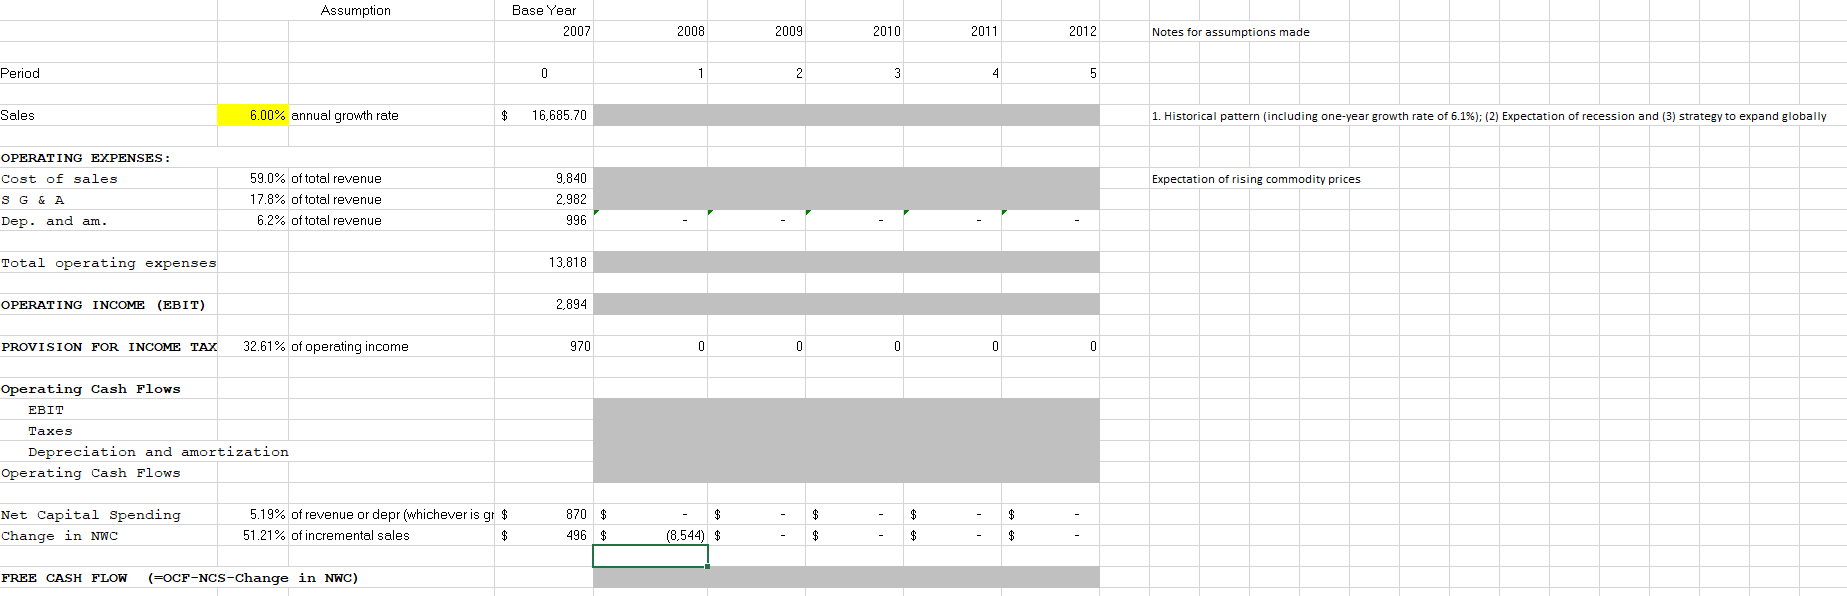
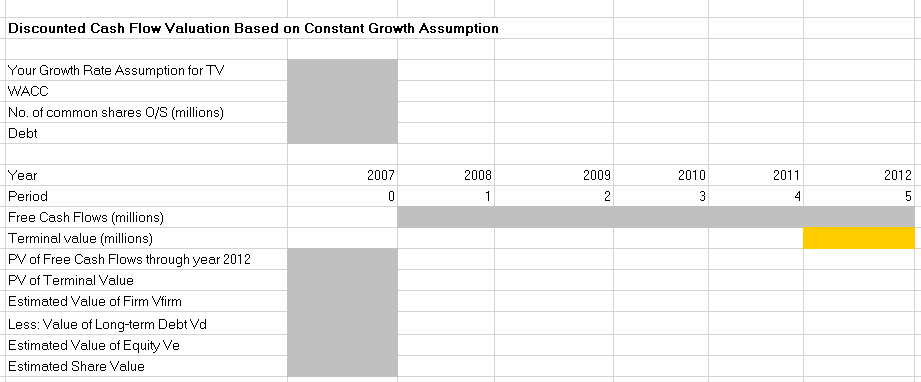
Exhibit1. Anheuser-Busch Balance Sheet (in Million \$, except per share) Dec.312006Dec.312007 Assets Current Assets Accounts receivable Inventories Other Current assets Investments in affiliated companies Total Current Assets Plant & equipment, net Intangible assets, including goodwill Other assets Total Assets \begin{tabular}{|r|r|} \hline 219.20 & 283.20 \\ \hline 720.20 & 805.20 \\ \hline 694.90 & 723.50 \\ \hline 195.20 & 212.60 \\ \hline 1,829.50 & 2,024.50 \\ \hline 3,680.30 & 4,019.50 \\ \hline 8,916.10 & 8,833.50 \\ \hline 1,367.20 & 1,547.90 \\ \hline 584.10 & 729.60 \\ \hline 16,377.20 & 17,155.00 \\ \hline \end{tabular} Liabilities and shareholders' equity Current liability Accounts payable Accrued salaries, wages and benefits Arrued taxes Accrued interest Total Current liability Retirement benefits Debt Deferred income taxes Other long term liabilities \begin{tabular}{|r|r|} \hline 1,426.30 & 1,464.50 \\ \hline 342.80 & 374.30 \\ \hline 133.90 & 106.20 \\ \hline 124.20 & 136.40 \\ \hline 218.90 & 222.40 \\ \hline 2,246.10 & 2,303.80 \\ \hline 1,191.50 & 1,002.50 \\ \hline 7,653.50 & 9,140.30 \\ \hline 1,194.50 & 1,314.60 \\ \hline 152.90 & 242.20 \\ \hline \end{tabular} Shareholders' Equity Common stock, $1 par value, authorized 1.6 billion shares Capital in excess of par value Retained earnings Treasury stock, at cost Accumulated non-owner changes in shareholder equity Total shareholders' equity Commitments and contingencies Total liabilities and shareholders' equity (Millions of dollars) Exhibit Notes Equity market cap as of 12/31/2007 (a) Book value of debt as of 12/31/2007 Credit rating A (b) Beta 0.6 (c) 10-year U.S. treasury YTM as of 12/31/2007 (d) A 10-yr corporate bond yield as of 12/31/2007 (e) expected annual market risk premium (f) tax rate (g) dividend growth rate (g) last dividend (a) closing share price 12/31/2007 (a) Cost of Equity Ke: CAPM Constant dividend growth (or "Dividend Discount Model") WACC: with Ke based on CAPM with Ke based on Constant dividend growth model Assumption Base Year 1 2 3 4 5 Sales 6.00% annual growth rate 16.685 .70 1. Historical pattern (including one-year growth rate of 6.1\%); (2) Expectation of recession and (3) strategy to expand globally OPERATING EXPENSES : Cost of sales 59.0% of total revenue Expectation of rising commodity prices 17.8% of total revenue Total operating expenses OPERATING INCOME (EBIT) PROVISION FOR INCOME TAX 32.61% of operating income Operating Cash Flows EBIT Taxes Depreciation and amortization Operating Cash Flows Net Capital Spending Change in NWC 5.19%ofrevenueordepr(whicheverisgr51.21%ofincrementalsales$$ 870 FREE CASH FLOW (=OCF-NCS-Change in NWC) Discounted Cash Flow Valuation Based on Constant Growth Assumption Your Growth Rate Assumption for TV WACC No. of common shares 0/S (millions) Debt Year Period Free Cash Flows (millions) Terminal value (millions) PV of Free Cash Flows through year 2012 PVof Terminal Value Estimated Value of Firm Vfirm Less: Value of Long-term Debt d Estimated Value of Equity Ve Estimated Share Value Exhibit1. Anheuser-Busch Balance Sheet (in Million \$, except per share) Dec.312006Dec.312007 Assets Current Assets Accounts receivable Inventories Other Current assets Investments in affiliated companies Total Current Assets Plant & equipment, net Intangible assets, including goodwill Other assets Total Assets \begin{tabular}{|r|r|} \hline 219.20 & 283.20 \\ \hline 720.20 & 805.20 \\ \hline 694.90 & 723.50 \\ \hline 195.20 & 212.60 \\ \hline 1,829.50 & 2,024.50 \\ \hline 3,680.30 & 4,019.50 \\ \hline 8,916.10 & 8,833.50 \\ \hline 1,367.20 & 1,547.90 \\ \hline 584.10 & 729.60 \\ \hline 16,377.20 & 17,155.00 \\ \hline \end{tabular} Liabilities and shareholders' equity Current liability Accounts payable Accrued salaries, wages and benefits Arrued taxes Accrued interest Total Current liability Retirement benefits Debt Deferred income taxes Other long term liabilities \begin{tabular}{|r|r|} \hline 1,426.30 & 1,464.50 \\ \hline 342.80 & 374.30 \\ \hline 133.90 & 106.20 \\ \hline 124.20 & 136.40 \\ \hline 218.90 & 222.40 \\ \hline 2,246.10 & 2,303.80 \\ \hline 1,191.50 & 1,002.50 \\ \hline 7,653.50 & 9,140.30 \\ \hline 1,194.50 & 1,314.60 \\ \hline 152.90 & 242.20 \\ \hline \end{tabular} Shareholders' Equity Common stock, $1 par value, authorized 1.6 billion shares Capital in excess of par value Retained earnings Treasury stock, at cost Accumulated non-owner changes in shareholder equity Total shareholders' equity Commitments and contingencies Total liabilities and shareholders' equity (Millions of dollars) Exhibit Notes Equity market cap as of 12/31/2007 (a) Book value of debt as of 12/31/2007 Credit rating A (b) Beta 0.6 (c) 10-year U.S. treasury YTM as of 12/31/2007 (d) A 10-yr corporate bond yield as of 12/31/2007 (e) expected annual market risk premium (f) tax rate (g) dividend growth rate (g) last dividend (a) closing share price 12/31/2007 (a) Cost of Equity Ke: CAPM Constant dividend growth (or "Dividend Discount Model") WACC: with Ke based on CAPM with Ke based on Constant dividend growth model Assumption Base Year 1 2 3 4 5 Sales 6.00% annual growth rate 16.685 .70 1. Historical pattern (including one-year growth rate of 6.1\%); (2) Expectation of recession and (3) strategy to expand globally OPERATING EXPENSES : Cost of sales 59.0% of total revenue Expectation of rising commodity prices 17.8% of total revenue Total operating expenses OPERATING INCOME (EBIT) PROVISION FOR INCOME TAX 32.61% of operating income Operating Cash Flows EBIT Taxes Depreciation and amortization Operating Cash Flows Net Capital Spending Change in NWC 5.19%ofrevenueordepr(whicheverisgr51.21%ofincrementalsales$$ 870 FREE CASH FLOW (=OCF-NCS-Change in NWC) Discounted Cash Flow Valuation Based on Constant Growth Assumption Your Growth Rate Assumption for TV WACC No. of common shares 0/S (millions) Debt Year Period Free Cash Flows (millions) Terminal value (millions) PV of Free Cash Flows through year 2012 PVof Terminal Value Estimated Value of Firm Vfirm Less: Value of Long-term Debt d Estimated Value of Equity Ve Estimated Share Value