Answered step by step
Verified Expert Solution
Link Copied!

Question

1 Approved Answer

Los Angeles workers have an average commute of 34 minutes. Suppose the LA commute time is normally distributed with a standard deviation of13 minutes. Let

image text in transcribedimage text in transcribedimage text in transcribedimage text in transcribedimage text in transcribedimage text in transcribed
Los Angeles workers have an average commute of 34 minutes. Suppose the LA commute time is normally distributed with a standard deviation of13 minutes. Let X represent the commute time for a randomly selected LA worker. Round all answers to 4 decimal places where possible. a. What is the distribution of X? it ~ Ni || 1 b. Find the probability that a randomly.r selected LAworker has a commute that is longer than 33 minutes. c. Find the ?5th percentile for the commute time of Lworkers. minutes The percent of fat calories that a person in America consumes each day is normally-r distributed 1with a mean of about 33 and a standard deviation of '5'. Suppose that one individual is randomly chosen. Let X=percent of fat calories. Round all answers to 4 decimal places if where possible a. What is the distribution of X? X ~ N{ b. Find the probability.r that a randomly selected fat calorie percent is more than 43.| | c. Find the minimum number for the upper quarter of percent of fat calories. I I Suppose that the distance of fly.r balls hit to the outfield {in baseball] is normally distributed with a mean of 269 feet and a standard deviation of 40 feet. Let 3'; be the distance in feet for a fly.r ball. a. What is the distribution of X? it ~ Ni || 1. in. Find the probability that a randomly.r hit fl}...r ball travels less than 319 feet. Round to 4 decimal places. c. Find the 80th percentile for the distribution of distance of fly balls. Round to 2 decimal places. I lfeet The amount of time that people spend at lEiroirer Hot Springs is normally.r distributed with a mean of 68 minutes and a standard deviation of 16 minutes. Suppose one person at the hot spn'ngs is randomly chosen. Let K = the amount of time that person spent at Grover Hot Springs . Round all answers to 4 decimal places where possible. a. what it the distribution of K? it ~ M || 3 b. Find the probability that a randomly.r selected person at the hot springs stays longer then 1'2 minutes. c. The park service is considering offering a discount for the se of their patrons who spend the least time at the hot springs. What is the longest amount of time a patron can spend at the hot springs and still receive the discount?| minutes. d. Find the Inter Quartile Range [IQR] for time spent at the hot springs. [11: I Iniinutes [13: I lniinutes IQR: I I minutes In the 1992 presidential election, Alaska's 48 election districts averaged 1842 votes per district for President Clinton. The standard deviation was 588. [There are only 48 election districts in Masha] The distribution of the votes per district for President Clinton was bell-shaped. Let I = number of votes for President Clinton for an election district. (Source: The World Almanac and Book of Facts} Round all answers except part e. to 4 decimal places. a. What is the distribution of X? I ~ N|{| I: b. Is 1842 a population mean or a sample mean? c. Find the probability that a randomly selected district had fewer than 1228 votes for President Clinton. d. Find the probability that a randomly selected district had between 19?? and 2258 votes for President Clinton. I | e. Find the third quartile for votes for President Clinton. Round your answer to the nearest whole number. 6 The mean height of an adult giraffe is 17 feet. Suppose that the distribution is normally distributed with standard deviation 1 feet. Let X be the height of a randomly selected adult giraffe. Round all answers to 4 decimal places where possible. a. What is the distribution of X? X - N( b. What is the median giraffe height? ft. c. What is the Z-score for a giraffe that is 20 foot tall? d. What is the probability that a randomly selected giraffe will be shorter than 17.4 feet tall? e. What is the probability that a randomly selected giraffe will be between 18 and 18.6 feet tall? f. The 80th percentile for the height of giraffes is ft

Step by Step Solution

There are 3 Steps involved in it

Step: 1

blur-text-image

Get Instant Access to Expert-Tailored Solutions

See step-by-step solutions with expert insights and AI powered tools for academic success

Step: 2

blur-text-image

Step: 3

blur-text-image

Ace Your Homework with AI

Get the answers you need in no time with our AI-driven, step-by-step assistance

Get Started

Recommended Textbook for

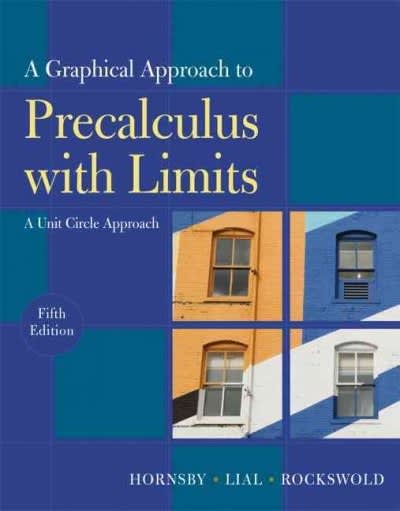
Graphical Approach To Precalculus With Limits A Unit Circle Approach, A

Authors: John E Hornsby, Margaret L Lial, Gary K Rockswold

5th Edition

0321899806, 9780321899804

More Books

Students also viewed these Mathematics questions

Question

Why are ratios and trends used in financial analysis?

Answered: 1 week ago

Question

Context, i.e. the context of the information presented and received

Answered: 1 week ago