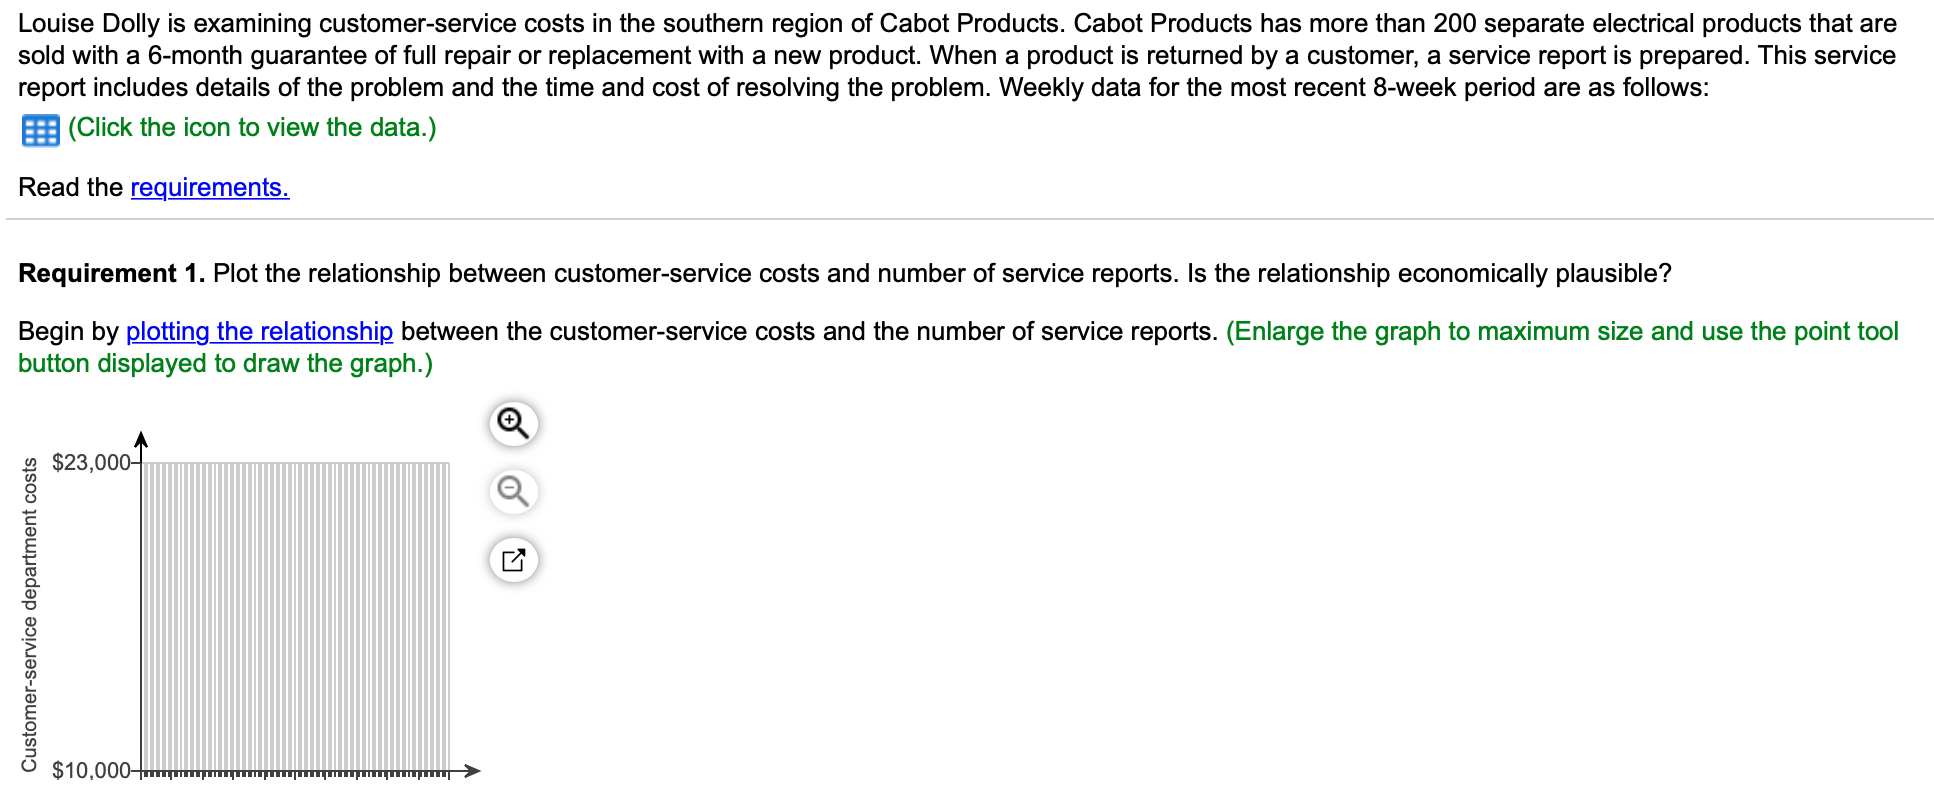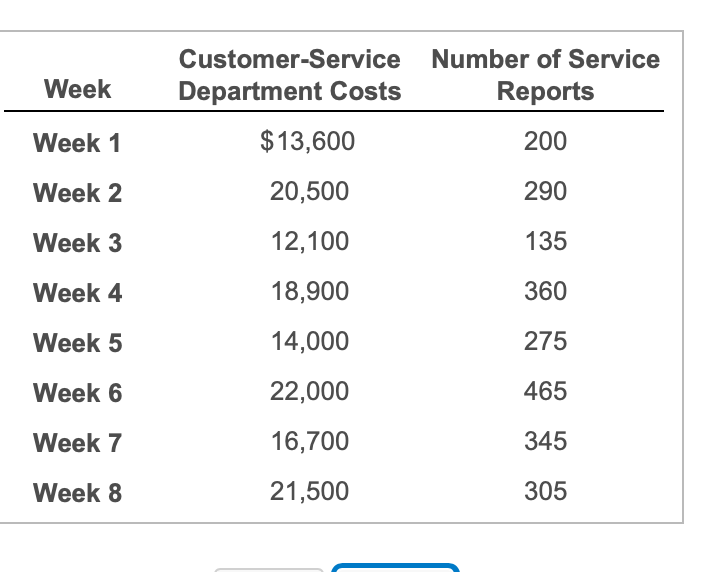


Louise Dolly is examining customer-service costs in the southern region of Cabot Products. Cabot Products has more than 200 separate electrical products that are sold with a 6-month guarantee of full repair or replacement with a new product. When a product is returned by a customer, a service report is prepared. This service report includes details of the problem and the time and cost of resolving the problem. Weekly data for the most recent 8-week period are as follows: (Click the icon to view the data.) Read the requirements. Requirement 1. Plot the relationship between customer-service costs and number of service reports. Is the relationship economically plausible? Begin by plotting the relationship between the customer-service costs and the number of service reports. (Enlarge the graph to maximum size and use the point tool button displayed to draw the graph.) $23,000- Customer-service department costs $10,000 Week Customer-Service Number of Service Department Costs Reports $13,600 200 20,500 290 Week 1 Week 2 Week 3 12,100 135 Week 4 18,900 360 Week 5 14,000 275 Week 6 22,000 465 Week 7 16,700 345 Week 8 21,500 305 1. 2. Plot the relationship between customer-service costs and number of service reports. Is the relationship economically plausible? Use the high-low method to compute the cost function, relating customer-service costs to the number of service reports. What variables, in addition to number of service reports, might be cost drivers of weekly customer-service costs of Cabot Products? 3. Louise Dolly is examining customer-service costs in the southern region of Cabot Products. Cabot Products has more than 200 separate electrical products that are sold with a 6-month guarantee of full repair or replacement with a new product. When a product is returned by a customer, a service report is prepared. This service report includes details of the problem and the time and cost of resolving the problem. Weekly data for the most recent 8-week period are as follows: (Click the icon to view the data.) Read the requirements. Requirement 1. Plot the relationship between customer-service costs and number of service reports. Is the relationship economically plausible? Begin by plotting the relationship between the customer-service costs and the number of service reports. (Enlarge the graph to maximum size and use the point tool button displayed to draw the graph.) $23,000- Customer-service department costs $10,000 Week Customer-Service Number of Service Department Costs Reports $13,600 200 20,500 290 Week 1 Week 2 Week 3 12,100 135 Week 4 18,900 360 Week 5 14,000 275 Week 6 22,000 465 Week 7 16,700 345 Week 8 21,500 305 1. 2. Plot the relationship between customer-service costs and number of service reports. Is the relationship economically plausible? Use the high-low method to compute the cost function, relating customer-service costs to the number of service reports. What variables, in addition to number of service reports, might be cost drivers of weekly customer-service costs of Cabot Products? 3


