

Answered step by step
Verified Expert Solution
Question
1 Approved Answer
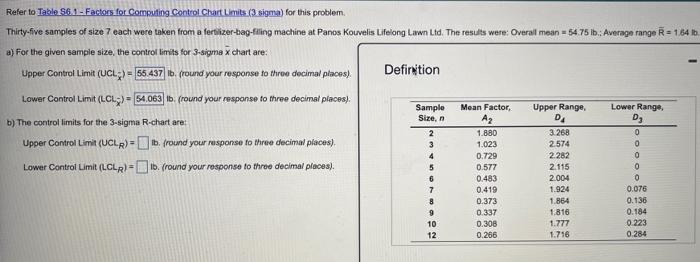
Lower Range Siren Refer to Table 56.1-Factor for Computing Control Chart Limits (3 sigma) for this problem Thirty-five samples of size 7 each were taken
Step by Step Solution
There are 3 Steps involved in it
Step: 1

Get Instant Access to Expert-Tailored Solutions
See step-by-step solutions with expert insights and AI powered tools for academic success
Step: 2

Step: 3
Ace Your Homework with AI
Get the answers you need in no time with our AI-driven, step-by-step assistance
Get Started
Do It Yourself Home Energy Audits 140 Simple Solutions To Lower Energy Costs, Increase Your Home's Efficiency, And Save The Environmen
Authors: David Findley
1st Edition
0071636390, 978-0071636391