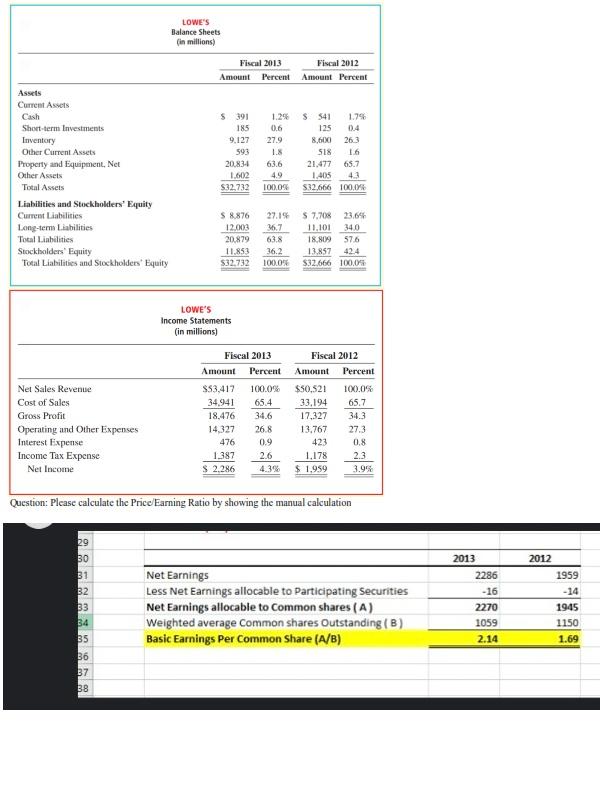
LOWES Balance Sheets in millions) Fiscal 2013 Fiscal 2012 Amount Percent Amount Percent 1.79 Assets Current Ass Cash Short-term Investments Inventory Other Current Assets Property and Equipment, Net Other Assets Total Assets Liabilities and Stockholders' Equity Current Liabilities Long-term Liabilities Total Liabilities Stockholders' Equity Total Liabilities and Stockholders' Equity $ 391 185 9.127 593 20.834 1.602 $32.732 0.6 279 1.8 63.6 4.9 100.0% $ 541 125 0.4 8,6130 263 518 1.6 21.477 65.7 1,405 43 S32.666 100.0% S 8.876 12.000 20.879 11.853 $32.732 27.19 36.7 63.8 36.2 100.0% 5 7.703 23.6% 11.101 340 18.809 576 13,857 424 $32.666 100.05 LOWE'S Income Statements (in millions) Net Sales Revenue Cost of Sales Gross Profit Operating and Other Expenses Interest Expense Income Tax Expense Net Income Fiscal 2013 Amount Percent S53.417 100.0% 34.941 65.4 18.476 34.6 14,327 26.8 476 0.9 1.387 2.6 $ 2.286 4.3% Fiscal 2012 Amount Percent $50,521 100.0% 33.194 65.7 17,327 34.3 13,767 27.3 423 0.8 1.178 2.3 $1.959 3.9% Question: Please calculate the Price Earning Ratio by showing the manual calculation 29 30 31 32 33 34 35 36 37 BB Net Earnings Less Net Earnings allocable to Participating Securities Net Earnings allocable to common shares (A) Weighted average Common shares Outstanding (B) Basic Earnings Per Common Share (A/B) 2013 2286 - 16 2270 1059 2.14 2012 1959 -14 1945 1150 1.69 LOWES Balance Sheets in millions) Fiscal 2013 Fiscal 2012 Amount Percent Amount Percent 1.79 Assets Current Ass Cash Short-term Investments Inventory Other Current Assets Property and Equipment, Net Other Assets Total Assets Liabilities and Stockholders' Equity Current Liabilities Long-term Liabilities Total Liabilities Stockholders' Equity Total Liabilities and Stockholders' Equity $ 391 185 9.127 593 20.834 1.602 $32.732 0.6 279 1.8 63.6 4.9 100.0% $ 541 125 0.4 8,6130 263 518 1.6 21.477 65.7 1,405 43 S32.666 100.0% S 8.876 12.000 20.879 11.853 $32.732 27.19 36.7 63.8 36.2 100.0% 5 7.703 23.6% 11.101 340 18.809 576 13,857 424 $32.666 100.05 LOWE'S Income Statements (in millions) Net Sales Revenue Cost of Sales Gross Profit Operating and Other Expenses Interest Expense Income Tax Expense Net Income Fiscal 2013 Amount Percent S53.417 100.0% 34.941 65.4 18.476 34.6 14,327 26.8 476 0.9 1.387 2.6 $ 2.286 4.3% Fiscal 2012 Amount Percent $50,521 100.0% 33.194 65.7 17,327 34.3 13,767 27.3 423 0.8 1.178 2.3 $1.959 3.9% Question: Please calculate the Price Earning Ratio by showing the manual calculation 29 30 31 32 33 34 35 36 37 BB Net Earnings Less Net Earnings allocable to Participating Securities Net Earnings allocable to common shares (A) Weighted average Common shares Outstanding (B) Basic Earnings Per Common Share (A/B) 2013 2286 - 16 2270 1059 2.14 2012 1959 -14 1945 1150 1.69