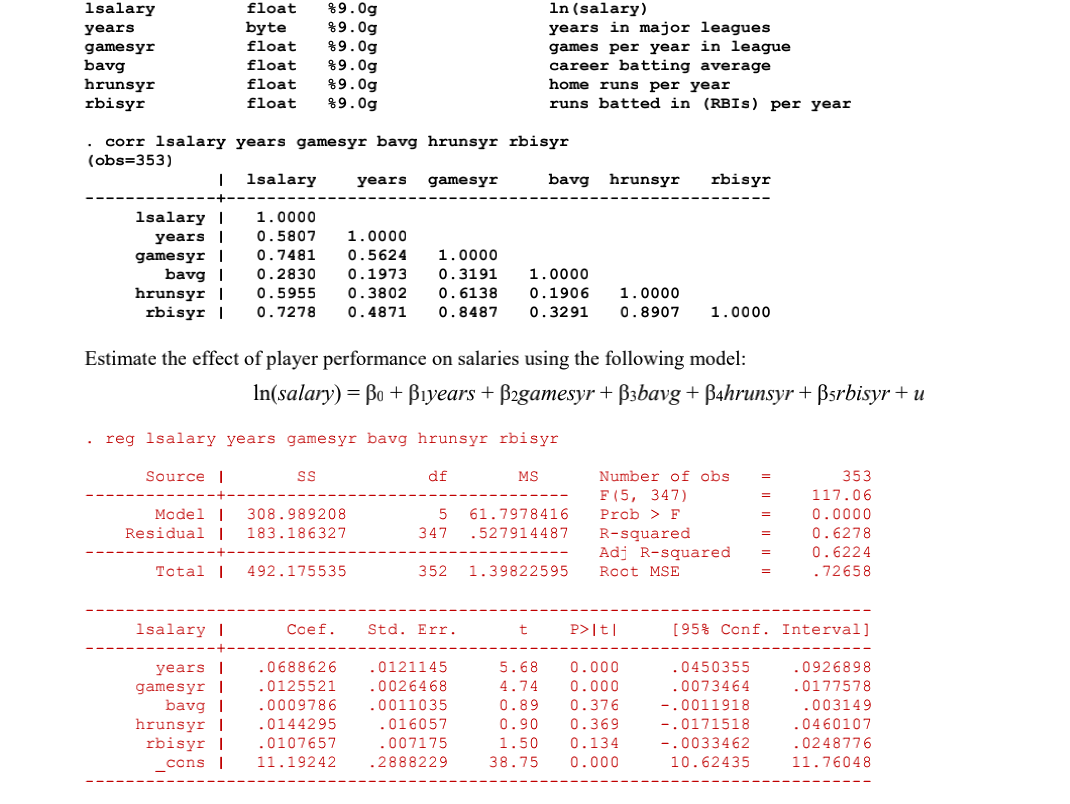
lsalary years gamesyr bavg hrunsyr rbisyr float byte float float float float $9.0g $9.0g $9.0g $9.0g $9.0g $9.0g ln (salary) years in major leagues games per year in league career batting average home runs per year runs batted in (RBIS) per year corr lsalary years gamesyr bavg hrunsyr rbisyr (obs=353) I lsalary years gamesyr bavg hrunsyr rbisyr lsalary years gamesyr bavg 1 hrunsyr | rbisyr 1.0000 0.5807 0.7481 0.2830 0.5955 0.7278 1.0000 0.5624 0.1973 0.3802 0.4871 1.0000 0.3191 0.6138 0.8487 1.0000 0.1906 0.3291 1.0000 0.8907 1.0000 Estimate the effect of player performance on salaries using the following model: In(salary) = Bo + Byears + B2gamesyr + B3bavg + B4hrunsyr + Bsrbisyr + u reg lsalary years gamesyr bavg hrunsyr rbisyr Source SS df MS 353 Model Residual 308.989208 183.186327 5 347 61.7978416 .527914487 Number of obs F (5, 347) Prob > F R-squared Adj R-squared Roat MSE 117.06 0.0000 0.6278 0.6224 .72658 Total 1 492.175535 352 1.39822595 lsalary | Coef. Std. Err. t P>It! [95% Conf. Interval] years game syr bavg hrunsyr | rbisyr 1 cons | .0688626 .0125521 .0009786 .0144295 .0107657 11.19242 .0121145 .0026468 .0011035 .016057 .007175 .2888229 5.68 4.74 0.89 0.90 1.50 38.75 0.000 0.000 0.376 0.369 0.134 0.000 .0450355 .0073464 -.0011918 -.0171518 -.0033462 10.62435 .0926898 .0177578 .003149 .0460107 .0248776 11.76048 lsalary years gamesyr bavg hrunsyr rbisyr float byte float float float float $9.0g $9.0g $9.0g $9.0g $9.0g $9.0g ln (salary) years in major leagues games per year in league career batting average home runs per year runs batted in (RBIS) per year corr lsalary years gamesyr bavg hrunsyr rbisyr (obs=353) I lsalary years gamesyr bavg hrunsyr rbisyr lsalary years gamesyr bavg 1 hrunsyr | rbisyr 1.0000 0.5807 0.7481 0.2830 0.5955 0.7278 1.0000 0.5624 0.1973 0.3802 0.4871 1.0000 0.3191 0.6138 0.8487 1.0000 0.1906 0.3291 1.0000 0.8907 1.0000 Estimate the effect of player performance on salaries using the following model: In(salary) = Bo + Byears + B2gamesyr + B3bavg + B4hrunsyr + Bsrbisyr + u reg lsalary years gamesyr bavg hrunsyr rbisyr Source SS df MS 353 Model Residual 308.989208 183.186327 5 347 61.7978416 .527914487 Number of obs F (5, 347) Prob > F R-squared Adj R-squared Roat MSE 117.06 0.0000 0.6278 0.6224 .72658 Total 1 492.175535 352 1.39822595 lsalary | Coef. Std. Err. t P>It! [95% Conf. Interval] years game syr bavg hrunsyr | rbisyr 1 cons | .0688626 .0125521 .0009786 .0144295 .0107657 11.19242 .0121145 .0026468 .0011035 .016057 .007175 .2888229 5.68 4.74 0.89 0.90 1.50 38.75 0.000 0.000 0.376 0.369 0.134 0.000 .0450355 .0073464 -.0011918 -.0171518 -.0033462 10.62435 .0926898 .0177578 .003149 .0460107 .0248776 11.76048


