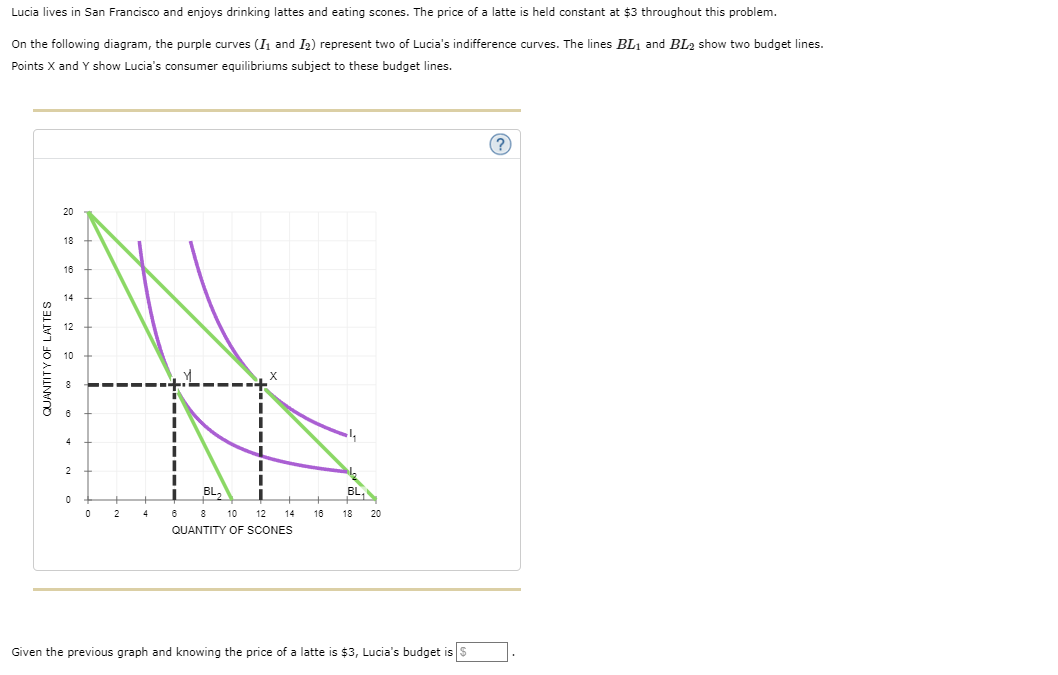
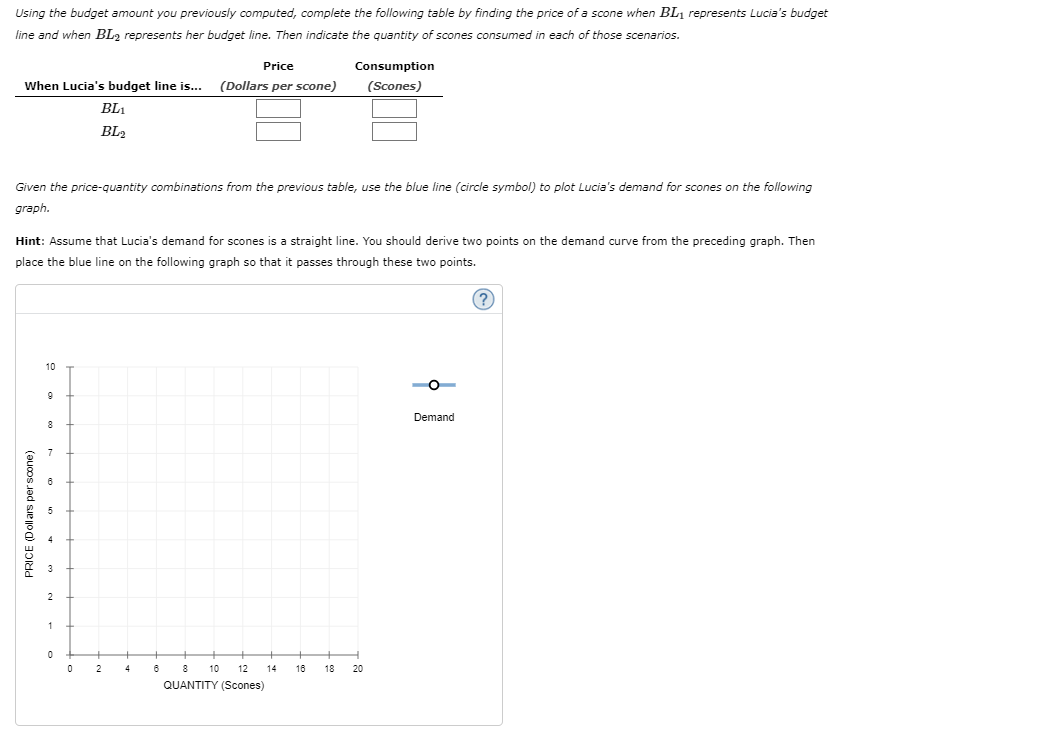
Lucia lives in San Francisco and enjoys drinking lattes and eating scones. The price of a latte is held constant at $3 throughout this problem. On the following diagram, the purple curves (I1 and I2 ) represent two of Lucia's indifference curves. The lines BL1 and BL2 show two budget lines. Points X and Y show Lucia's consumer equilibriums subject to these budget lines. Given the previous graph and knowing the price of a latte is $3, Lucia's budget is Using the budget amount you previously computed, complete the following table by finding the price of a scone when BL L1 represents Lucia's budget line and when BL2 represents her budget line. Then indicate the quantity of scones consumed in each of those scenarios. Given the price-quantity combinations from the previous table, use the blue line (circle symbol) to plot Lucia's demand for scones on the following graph. Hint: Assume that Lucia's demand for scones is a straight line. You should derive two points on the demand curve from the preceding graph. Then place the blue line on the following graph so that it passes through these two points. Lucia lives in San Francisco and enjoys drinking lattes and eating scones. The price of a latte is held constant at $3 throughout this problem. On the following diagram, the purple curves (I1 and I2 ) represent two of Lucia's indifference curves. The lines BL1 and BL2 show two budget lines. Points X and Y show Lucia's consumer equilibriums subject to these budget lines. Given the previous graph and knowing the price of a latte is $3, Lucia's budget is Using the budget amount you previously computed, complete the following table by finding the price of a scone when BL L1 represents Lucia's budget line and when BL2 represents her budget line. Then indicate the quantity of scones consumed in each of those scenarios. Given the price-quantity combinations from the previous table, use the blue line (circle symbol) to plot Lucia's demand for scones on the following graph. Hint: Assume that Lucia's demand for scones is a straight line. You should derive two points on the demand curve from the preceding graph. Then place the blue line on the following graph so that it passes through these two points