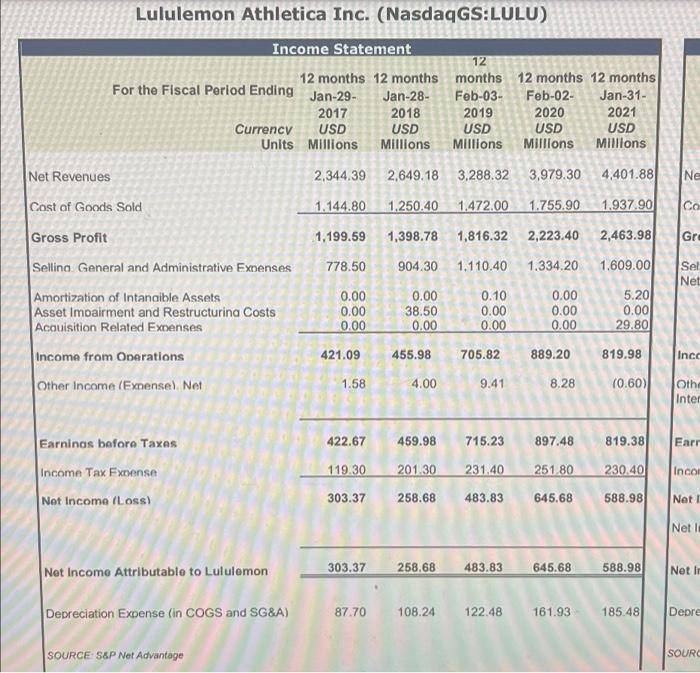
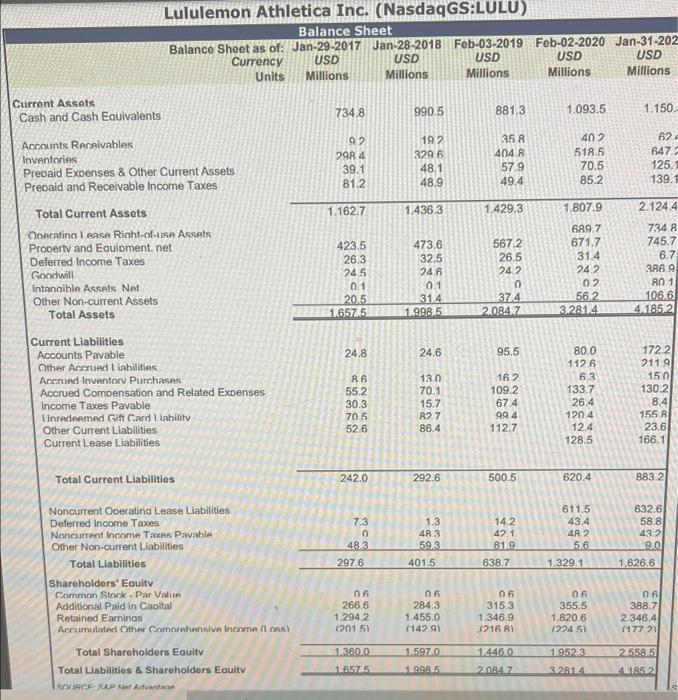
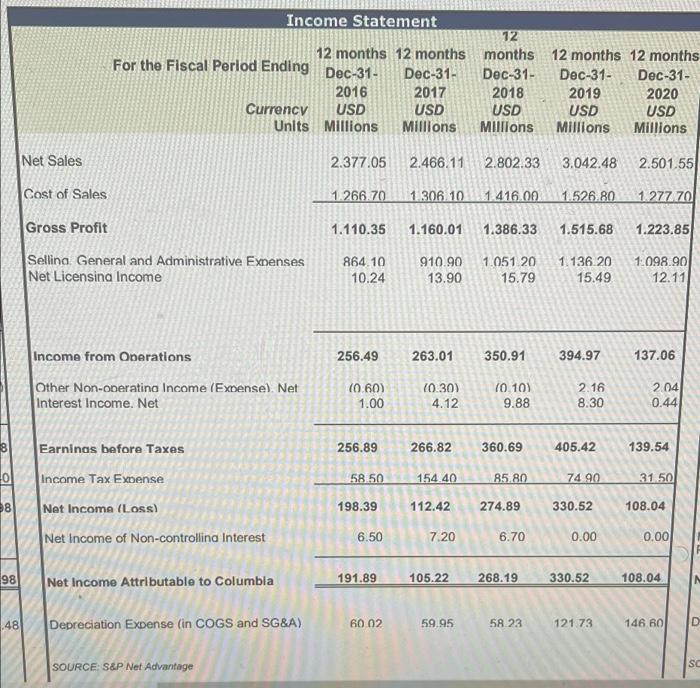
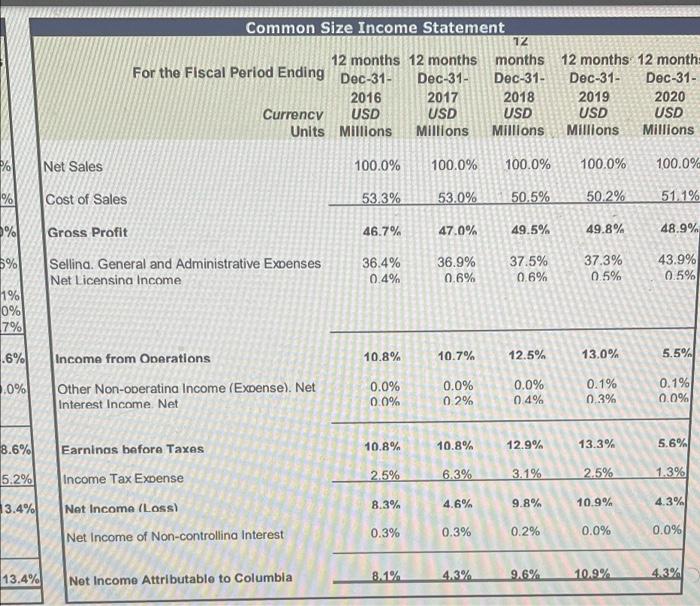
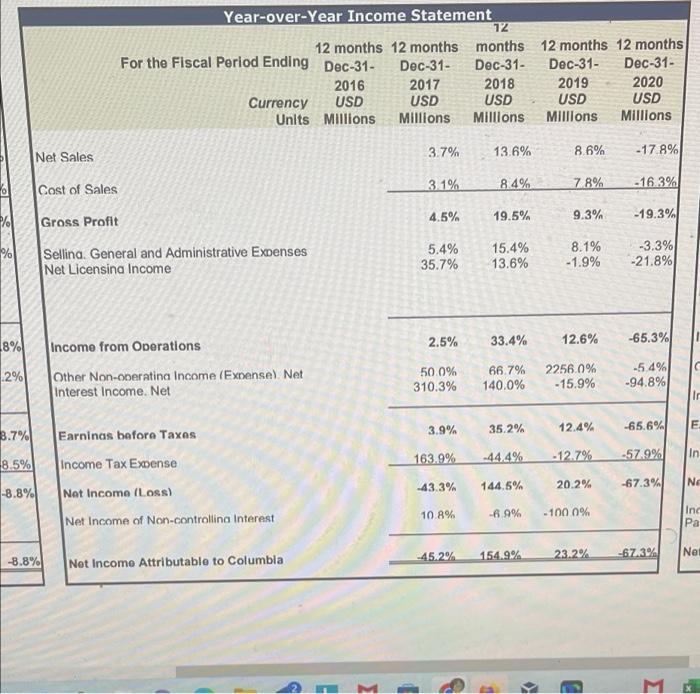
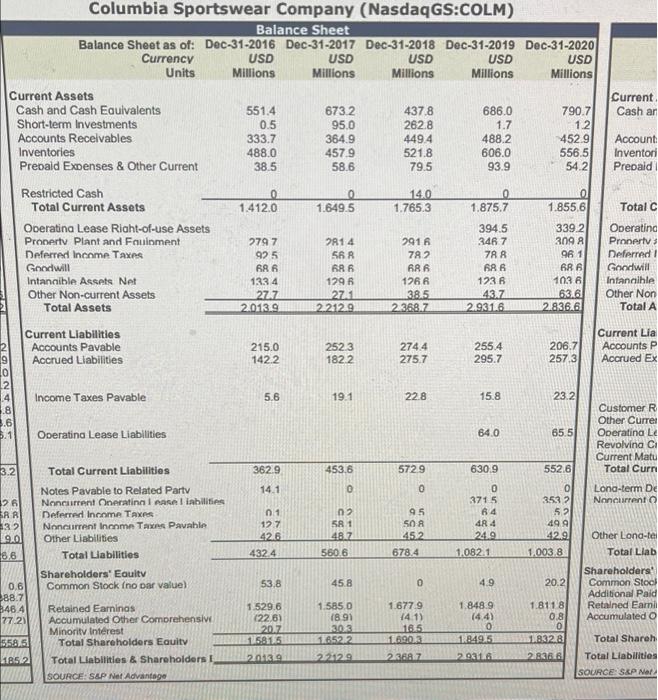
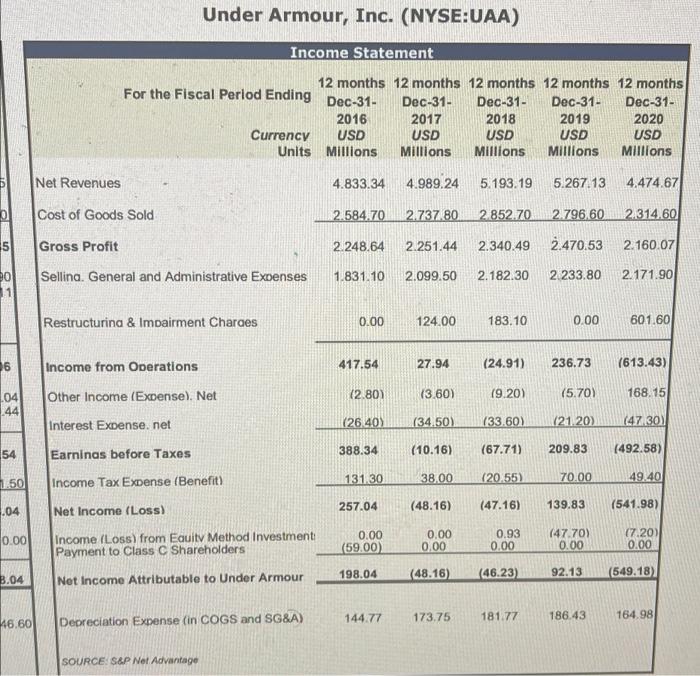
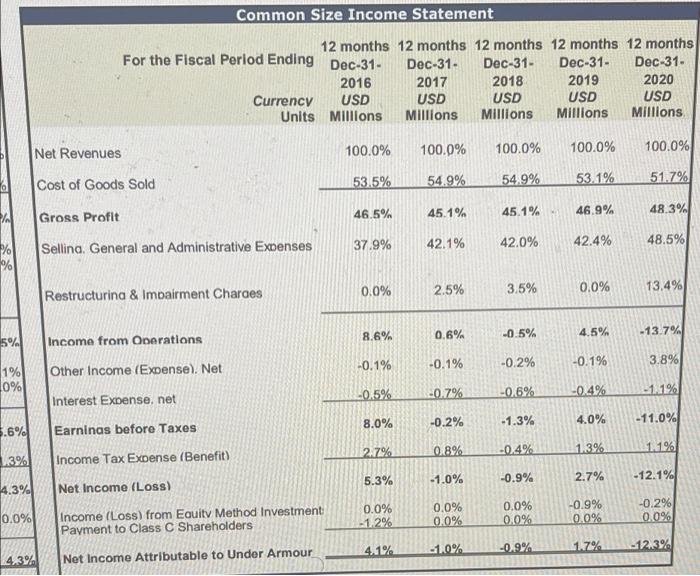
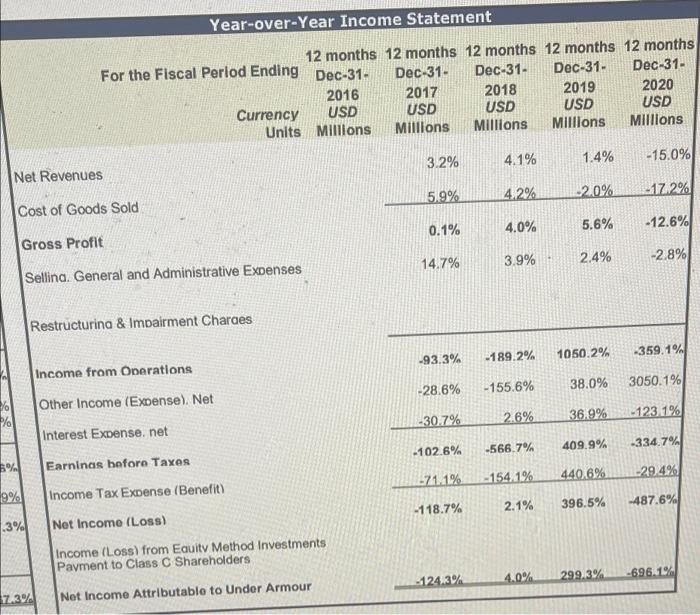
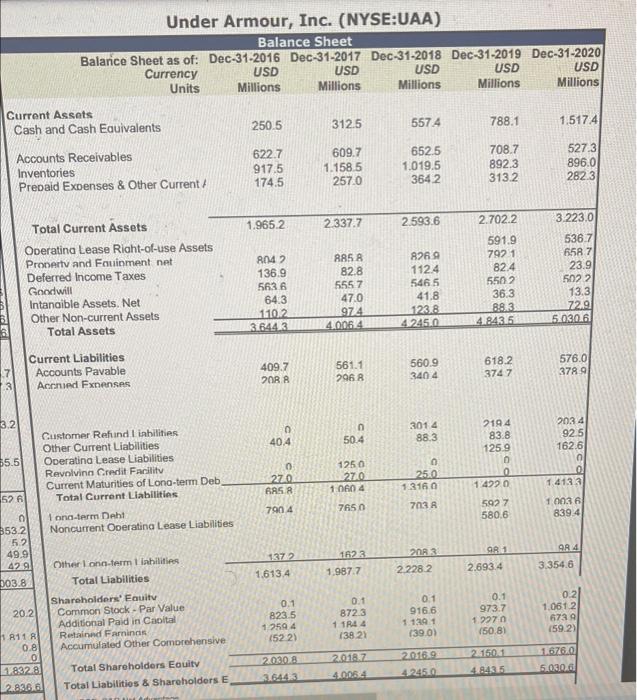
Lululemon Athletica Inc. (NasdaqGS:LULU) Income Statement 12 months 12 months 12 months 12 months Feb-03- Feb-02- 12 months For the Fiscal Period Ending Jan-29- Jan-28- Jan-31- 2017 2018 2019 2020 2021 Currency USD USD USD USD USD Millions Units Millions Millions Millions Millions 2,344.39 2,649.18 3,288.32 3,979.30 4.401.88 1.144.80 1.250.40 1.472.00 1.755.90 1.937.90 1,199.59 1,398.78 1,816.32 2,223.40 2,463.98 1.110.40 1.334.20 1.609.00 778.50 904.30 0.00 0.00 0.10 0.00 5.20 0.00 38.50 0.00 0.00 0.00 0.00 0.00 0.00 0.00 29.80 455.98 705.82 889.20 4.00 9.41 8.28 459.98 715.23 897.48 201.30 231.40 251.80 258.68 483.83 645.68 258.68 483.83 645.68 108.24 122.48 161.93 Net Revenues Cost of Goods Sold Gross Profit Selling General and Administrative Expenses Amortization of Intangible Assets Asset Impairment and Restructuring Costs Acquisition Related Expenses Income from Operations Other Income (Expense). Net Earnings before Taxes Income Tax Expense Net Income (Loss) Net Income Attributable to Lululemon Depreciation Expense (in COGS and SG&A) SOURCE: S&P Net Advantage 421.09 1.58 422.67 119.30 303.37 303.37 87.70 819.98 (0.60) 819.38 230.40 588.98 588.98 185.48 Ne Co Gre Sel Net Inco Othe Inter Earr Incon Net I Net In Net In Depre SOURC Lululemon Athletica Inc. (NasdaqGS:LULU) Balance Sheet Balance Sheet as of: Jan-29-2017 Jan-28-2018 Feb-03-2019 Feb-02-2020 Jan-31-202 USD USD USD USD USD Currency Units Millions Millions Millions Millions Millions 1.150 62 Current Assets Cash and Cash Equivalents Accounts Receivables Inventories Prepaid Expenses & Other Current Assets Prepaid and Receivable Income Taxes Total Current Assets. Operating I ease Right-of-use Assets Property and Equipment, net Deferred Income Taxes Goodwill Intangible Assets Net Other Non-current Assets Total Assets Current Liabilities Accounts Pavable. Other Accrued liabilities Accrued Inventory Purchases Accrued Compensation and Related Expenses Income Taxes Pavable. Unredeemed Gift Card Liability Other Current Liabilities Current Lease Liabilities Total Current Liabilities Noncurrent Operating Lease Liabilities Deferred Income Taxes Noncurrent Income Taxes Pavable Other Non-current Liabilities Total Liabilities Shareholders' Equity Common Stock - Par Value Additional Paid in Capital Retained Earnings Accumulated Other Comprehensive Income foss) Total Shareholders Equity Total Liabilities & Shareholders Equitv SOURCE SAP Net Artvantage 734.8 92 298 4 39.1 81.2 1.162.7 423.5 26.3 24.5 01. 20.5 1.657.5 24.8 A6 55.2 30.3 70.5 52.6 242.0 7.3 0 48.3 297.6 06 266.6 1.294.2 (2015) 1.360.0 1.657.5 990.5 192 329.6 48.1 48.9 1.436.3 473,6 32.5 24 6 0.1 31.4 1.998.5 24.6 13.0 70.1 15.7 82.7 86.4 292.6 1.3 48.3 59.3 401.5 06 284.3 1.455.0 (142 9) 1.597.0 1.998.5 881.3 35.8 404 8 57.9 49.4 1.429.3 567.2 26.5 24.2 0 37.4 2.084.7 95.5 16.2 109.2 67.4 99 4 112.7 500.5 14.2 42.1 81.9 638.7 06 315.3 1.346.9 1216 A) 1.446.0 2.084.7 1.093.5 402 518.5 70.5 85.2 1.807.9 689.7 671.7 31.4 24.2 02 56.2 3.281.4 80.0 112.6 6.3 133.7 26.4 120.4 12.4 128.5 620.4 611.5 43.4 48 2 5.6 1.329.1 06 355.5 1.820.6 (2245) 1.952.3 3.281.4 647 125.1 139.1 2.124.4 734 8 745.7 6.7 386.9 80.1 106.6 4.185.2 172.2 2119 15.0 130.2 8.4 155 8 23.6 166.1 883.2 632.6 58.8 432 9.0 1,626.6 06 388.7 2.346.4 (177.21 2.558.5 4.185.2 8 0 98 98 48 Income Statement 12 12 months 12 months months 12 months 12 months For the Fiscal Perlod Ending Dec-31- Dec-31- Dec-31- Dec-31- Dec-31- 2016 2017 2018 2019 2020 Currency USD USD USD USD USD Units Millions Millions Millions Millions Millions 2.377.05 2.466.11 2.802.33 3.042.48 2.501.55 1.266.70 1.306.10 1.416.00 1.526.80 1.277.70 1.110.35. 1.160.01 1.386.33 1.515.68 1.223.85 864.10 910.90 1.051 20 1.136.20 1.098.90 15.49 10.24 13.90 15.79 12.11 394.97 137.06 2.16 2.04 8.30 0.44 Net Sales Cost of Sales Gross Profit Sellina General and Administrative Expenses Net Licensina Income Income from Operations Other Non-operating Income (Expense). Net Interest Income. Net Earnings before Taxes Income Tax Expense Net Income (Loss) Net Income of Non-controlling Interest Net Income Attributable to Columbia Depreciation Expense (in COGS and SG&A) SOURCE: S&P Net Advantage 256.49 (0.60) 1.00 256.89 58.50 198.39 6.50 191.89 60.02 263.01 (0.30) 4.12 266.82 350.91 105.22 59.95 (0.10) 9.88 360.69 154.40 85.80 112.42 274.89 7.20 6.70 268.19 58.23 405.42 74.90 330.52 0.00 330.52 121.73 139.54 31.50 108.04 0.00 108.04 146.60 M D SC Columbia Sportswear Company (NasdaqGS:COLM) Income Statement 12 12 months 12 months For the Fiscal Period Ending Dec-31- Dec-31- months 12 months 12 months Dec-31- Dec-31- Dec-31- 2016 2017 2018 2019 2020 Currency USD USD USD USD USD Units Millions Millions Millions Millions Millions 2.377.05 2.466.11 2.802.33 3.042.48 2.501.55 1.266.70 1.306.10 1.416.00 1.526.80 1.277.70 1.110.35 1.160.01 1.386.33 1.515.68 1.223.85 864 10 910.90 1.051.20 1.136.20 1.098.90 10.24 13.90 15.79 15.49 12.11 Net Sales Cost of Sales Gross Profit Sellina General and Administrative Expenses Net Licensina Income Income from Operations Other Non-operating Income (Expense). Net Interest Income. Net Earnings before Taxes Income Tax Expense Net Income (Loss) Net Income of Non-controlling Interest Net Income Attributable to Columbia Depreciation Expense (in COGS and SG&A) SOURCE: S&P Net Advantage 8 18 256.49 (0.60) 1.00 256.89 58.50 198.39 6.50 191.89 60.02 263.01 105.22 350.91 (0.30) 4.12 266.82 154.40 85.80 112.42 274.89 7.20 6.70 59.95 (0.10) 9.88 360.69 268.19 58.23 394.97 2.16 8.30 405.42 74.90 137.06 2.04 0.44 139.54 31.50 108.04 330.52 0.00 0.00 330.52 108.04 121.73 146.60 % % % 5% 1% 0% 7% .6% .0% 8.6% 5.2% 3.4% 13.4% Common Size Income Statement 12 12 months 12 months For the Fiscal Period Ending Dec-31- Dec-31- 12 months 12 months months Dec-31- Dec-31- Dec-31- 2016 2017 2018 2019 2020 Currency USD USD USD USD USD Units Millions Millions Millions Millions Millions Net Sales 100.0% 100.0% 100.0% 100.0% Cost of Sales 53.0% 50.5% 50.2% 51.1% Gross Profit 47.0% 49.5% 49.8% 48.9% 36.9% 37.5% 37,3% 43.9% Sellina. General and Administrative Expenses Net Licensina Income 0.6% 0.6% 0.5% 0.5% Income from Operations 10.7% 12.5% 13.0% 0.0% 0.0% 0.1% Other Non-operatina Income (Expense). Net Interest Income. Net 0.2% 0.4% 0.3% Earnings before Taxes 10.8% 12.9% 13.3% Income Tax Expense 6.3% 3.1% 2.5% Net Income (Loss) 4.6% 9.8% 10.9% Net Income of Non-controlling Interest 0.3% 0.2% 0.0% Net Income Attributable to Columbia 4.3% 9.6% 10.9% 100.0% 53.3% 46.7% 36.4% 0.4% 10.8% 0.0% 0.0% 10.8% 2.5% 8.3% 0.3% 8.1% 5.5% 0.1% 0.0% 5.6% 1.3% 4.3% 0.0% 4.3% O % % 8% 2% 8.7% 8.5% -8.8% Year-over-Year Income Statement 12 12 months 12 months months For the Fiscal Period Ending Dec-31- Dec-31- Dec-31- 12 months 12 months Dec-31- Dec-31- 2017 2018 2019 2020 2016 USD USD USD USD USD Currency Units Millions Millions Millions Millions Millions Net Sales 3.7% 13.6% 8.6% -17.8% Cost of Sales 3.1% 8.4% 7.8% -16.3% Gross Profit 4.5% 19.5% 9.3% -19.3% 5.4% 15.4% 8.1% -3.3% Sellina. General and Administrative Expenses Net Licensina Income 35.7% 13.6% -1.9% -21.8% Income from Operations 2.5% 33.4% 12.6% -65.3% 50.0% 66.7% 2256.0% -5.4% Other Non-operating Income (Expense). Net Interest Income. Net 310.3% 140.0% -15.9% -94.8% Earnings before Taxes 3.9% 35.2% 12.4% -65.6% Income Tax Expense 163.9% -44.4% -12.7% -57.9% Net Income (Loss) -43.3% 144.5% 20.2% -67.3% Net Income of Non-controlling Interest 10.8% -6.9% -100.0% Net Income Attributable to Columbia -45.2% 154.9% 23.2% -8.8% N LI 3 P 1 K D -67.3% C Ir E. In Ne Inc Pa Net L Current Assets Cash and Cash Equivalents Short-term Investments Accounts Receivables Inventories Prepaid Expenses & Other Current Restricted Cash Total Current Assets Operating Lease Right-of-use Assets Property Plant and Fouinment Deferred Income Taxes Goodwill Intangible Assets Net Other Non-current Assets Total Assets Current Liabilities Accounts Pavable Accrued Liabilities 14 Income Taxes Pavable 8 .6 9 [0 2 AND 5.1 3.2 26 RA 132 9.0 6.6 Columbia Sportswear Company (NasdaqGS:COLM) Balance Sheet Balance Sheet as of: Dec-31-2016 Dec-31-2017 Dec-31-2018 Dec-31-2019 Dec-31-2020 Currency USD USD USD USD USD Units Millions Millions Millions Millions Millions 551.4 673.2 437.8 686.0 790.7 0.5 95.0 262.8 1.7 1.2 333.7 364.9 449.4 488.2 452.9 488.0 457.9 521.8 606.0 556.5 38.5 58.6 79.5 93.9 54.2 0 0 14.0 0 0 1.412.0 1.649.5 1.765.3 1.875.7 1.855.6 394.5 339.2 279 7 2814 2916 346.7 309 8 925 56.8 78.2 78 A 96 1 68 6 68 6 68 6 68 6 68 6 133 4 129 6 126.6 123 6 103 6 27.7 27.1 43.7 63.6 2.013.9 2.212.9 2.931.6 2.836.6 215.0 252.3 255.4 206.7 142.2 182.2 295.7 257.3 5.6 19.1 15.8 23.2 64.0 65.5 362.9 453.6 630.9 552.6 14.1 0 0 371 5 353 2 5.2 0.1 64 12.7 49.9 42.6 42.9 0,6 88.7 346.4 77.21 558.5 Tam 185.2 Operating Lease Liabilities Total Current Liabilities Notes Pavable to Related Party Noncurrent Onerating I ease 1 iabilities Deferred Income Taxes Noncurrent Income Taxes Pavable. Other Liabilities Total Liabilities Shareholders' Equitv Common Stock (no par value) Retained Earnings Accumulated Other Comprehensiv Minority Interest Total Shareholders Equity Total Liabilities & Shareholders I SOURCE: S&P Net Advantage 432.4 53.8 1.529.6 (22.6) 20.7 1.581.5 2013.9 0 02 58.1 48.7 560.6 45.8 1.585.0 (8.91 30.3 1.652.2 22129 38.5 2.368.7 274.4 275.7 22.8 572.9 0 95 50-8 45.2 678.4 0 1.677.9 (4.1) 16.5 1.690.3 2.368.7 48 4 24.9 1.082.1 4.9 1.848.9 (4.4) 0 1.849.5 2.931.6 1,003.8 20.2 1.8118 0.8 0 1.832.8 2.836.6 Current. Cash ar Account: Inventori Prepaid Total C Operating Property s Deferred I Goodwill Intangible Other Non Total A Current Lia Accounts P Accrued Ex Customer R Other Curre Operatina Le Revolvina Ci Current Matu Total Curri Long-term De Noncurrent O Other Long-te Total Liab Shareholders' Common Stock Additional Paid Retained Earni Accumulated O Total Shareh Total Liabilities SOURCE: S&P Net D 5 20 11 6 04 44 54 1.50 .04 0.00 8.04 46.60 Under Armour, Inc. (NYSE:UAA) Income Statement 12 months 12 months 12 months 12 months 12 months For the Fiscal Period Ending Dec-31- Dec-31- Dec-31- Dec-31- Dec-31- 2017 2018 2019 2020 Currency 2016 USD Millions USD USD USD USD Units Millions Millions Millions Millions 4.833.34 4.989.24 5.193.19 5.267.13 4.474.67 2.584.70 2.737.80 2.852.70 2.796.60 2.314.60 2.248.64 2.251.44 2.340.49 2.470.53 2.160.07 1.831.10 2.099.50 2.182.30 2.233.80 2.171.90 0.00 124.00 183.10 0.00 601.60 27.94 (24.91) 236.73 (613.43) (3.60) (9.20) (5.70) 168.15 (34.50) (33.60) (21.20) (47.30) (10.16) (67.71) 38.00 (20.55) 70.00 (48.16) (47.16) 139.83 0.00 0.93 (47.70) 0.00 92.13 186.43 Net Revenues Cost of Goods Sold Gross Profit Sellina. General and Administrative Expenses Restructuring & Impairment Charges Income from Operations Other Income (Expense). Net Interest Expense. net Earnings before Taxes Income Tax Expense (Benefit) Net Income (Loss) Income (Loss) from Eauitv Method Investment Payment to Class C Shareholders Net Income Attributable to Under Armour Depreciation Expense (in COGS and SG&A) SOURCE: S&P Net Advantage 417.54 (2.80) (26.40) 388.34 131.30 257.04 0.00 (59.00) 198.04 144.77 0.00 (48.16) 173.75 0.00 (46.23) 181.77 209.83 (492.58) 49.40 (541.98) (7.20) 0.00 (549.18) 164.98 O / % % 5% 1% 0% 5.6% 13% 4.3% 0.0% Common Size Income Statement 12 months 12 months 12 months 12 months 12 months For the Fiscal Period Ending Dec-31- Dec-31- Dec-31- Dec-31- Dec-31- 2017 2018 2019 2020 2016 USD USD USD USD USD Currency Units Millions Millions Millions Millions Millions. Net Revenues 100.0% 100.0% 100.0% Cost of Goods Sold 54.9% 53.1% 51.7% Gross Profit 45.1% 46.9% 48.3% Sellina. General and Administrative Expenses 42.0% 42.4% 48.5% Restructurina & Impairment Charaes 3.5% 0.0% 13.4% Income from Operations -0.5% 4.5% -13.7% Other Income (Expense). Net -0.2% 3.8% Interest Expense, net -0.6% Earnings before Taxes -1.3% -0.4% Income Tax Expense (Benefit) -0.9% Net Income (Loss) 0.0% Income (Loss) from Equity Method Investment Payment to Class C Shareholders 0.0% -0.9% Net Income Attributable to Under Armour 4.3% 100.0% 53.5% 46.5% 37.9% 0.0% 8.6% -0.1% -0.5% 8.0% 2.7% 5.3% 0.0% -1.2% 4.1% 100.0% 54.9% 45.1% 42.1% 2.5% 0.6% -0.1% -0.7% -0.2% 0.8% -1.0% 0.0% 0.0% -1.0% -0.1% -0.4% -1.1% 4.0% -11.0% 1.3% 1.1% 2.7% -12.1% -0.9% -0.2% 0.0% 0.0% 1.7% -12.3% Net Revenues Cost of Goods Sold Gross Profit Sellina. General and Administrative Expenses Restructurina & Impairment Charges Income from Operations Other Income (Expense). Net Interest Expense. net Earnings before Taxes Income Tax Expense (Benefit) Net Income (Loss) Income (Loss) from Equity Method Investments Payment to Class C Shareholders Net Income Attributable to Under Armour % % 5% Year-over-Year Income Statement 12 months 12 months 12 months 12 months 12 months For the Fiscal Period Ending Dec-31- Dec-31- Dec-31- Dec-31- Dec-31- 2016 2017 2018 2019 2020 USD USD Currency USD USD USD Units Millions Millions Millions Millions Millions -15.0% -17.2% -12.6% -2.8% 9% .3% 7.3% 4.1% 4.2% 4.0% 3.9% 3.2% 5.9% 0.1% 14.7% -93.3% -189.2% -28.6% -155.6% -30.7% 2.6% -102.6% -566.7% -71.1% -154.1% -118.7% 2.1% -124.3% 4.0% 1.4% -2.0% 5.6% 2.4% 1050.2% -359.1% 38.0% 3050.1% 36.9% -123.1% 409.9% -334.7% 440.6% -29.4% 396.5% -487.6% 299.3% -696.1% Current Assets Cash and Cash Equivalents Accounts Receivables Inventories Prepaid Expenses & Other Current/ Total Current Assets Operating Lease Right-of-use Assets Property and Fouinment net Deferred Income Taxes Goodwill Intangible Assets. Net Other Non-current Assets Total Assets Current Liabilities Accounts Pavable Accrued Expenses Customer Refund liabilities Other Current Liabilities Operating Lease Liabilities Revolving Credit Facility Current Maturities of Long-term Deb, Total Current Liabilities 1 ona-term Debl Noncurrent Operating Lease Liabilities Other long-term 1 iabilities Total Liabilities Shareholders' Equity Common Stock - Par Value Additional Paid in Capital ( Retained Farminas Accumulated Other Comprehensive Total Shareholders Equity Total Liabilities & Shareholders E 7 3.2 $5.5 52 6 0 353.2 5.2 49.9 42 9 003.8 Under Armour, Inc. (NYSE:UAA) Balance Sheet Balance Sheet as of: Dec-31-2016 Dec-31-2017 Dec-31-2018 Dec-31-2019 Dec-31-2020 Currency USD USD USD USD USD Units Millions Millions Millions Millions Millions 250.5 312.5 557.4 788.1 1.5174 622.7 609.7 652.5 708.7 527.3 917.5 1.158.5 1.019.5 892.3 896.0 174.5 257.0 364.2 313.2 282.3 1.965.2 2.337.7 2.593.6 2.702.2 591.9 8042 885.8 8269 792 1 136.9 82.8 112.4 82.4 563.6 5557 546.5 550.2 64.3 47.0 41.8 36.3 110.2 974 123.8 88.3 3.644 3 4.006.4 4.245.0 4.843.5 409.7 561.1 560.9 618.2 208.8 296.8 340 4 374 7 n 3014 2194 40.4 50.4 88.3 83.8 125.9 0 125.0 0 0 27.0 27.0 25.0 0 685.8 1:060 4 1.316.0 1422 0 790 4 765.0 703 R 592 7 580.6 137.2 1623 208 3 98.1 20.2 1811 R 0.8 0 1.832.8 2.836.6 1.613.4 0.1 823.5 1.259 4 (52.2) 2.030.8 3.6443 1.987.7 0.1 872.3 1.1844 (38.21 2018.7 4.006.4 2.228.2 0.1 916.6 1.139 1 (39.0) 2016.9 4.245.0 2.693.4 0.1 973.7 1.2270 (50,8) 2.150.1 4.8435 3.223.0 536.7 658 7 23.9 502.2 13.3 72.9 5.030.6 576.0 378 9 203 4 92.5 162.6 0 0 1.4133 1,003 6 839 4 3.354.6 0.2 1.061.2 673 9 (59.2) 1.676.0 5.030.6 1. Take a look at the year-over-year income statement. How have the three companies been performing over time in terms of revenue and income growth? 2. Take a look at the common size income statement and the profitability ratios. How have the three companies been performing over time in terms of profitability? 3. Take a look at the asset management ratios and the common size balance sheet. How well have the three companies been managing their assets? 4. Take a look at the liquidity ratios, debt ratios, and common size balance sheet. How are the companies doing with respect to being able to pay their debts? Lululemon Athletica Inc. (NasdaqGS:LULU) Income Statement 12 months 12 months 12 months 12 months Feb-03- Feb-02- 12 months For the Fiscal Period Ending Jan-29- Jan-28- Jan-31- 2017 2018 2019 2020 2021 Currency USD USD USD USD USD Millions Units Millions Millions Millions Millions 2,344.39 2,649.18 3,288.32 3,979.30 4.401.88 1.144.80 1.250.40 1.472.00 1.755.90 1.937.90 1,199.59 1,398.78 1,816.32 2,223.40 2,463.98 1.110.40 1.334.20 1.609.00 778.50 904.30 0.00 0.00 0.10 0.00 5.20 0.00 38.50 0.00 0.00 0.00 0.00 0.00 0.00 0.00 29.80 455.98 705.82 889.20 4.00 9.41 8.28 459.98 715.23 897.48 201.30 231.40 251.80 258.68 483.83 645.68 258.68 483.83 645.68 108.24 122.48 161.93 Net Revenues Cost of Goods Sold Gross Profit Selling General and Administrative Expenses Amortization of Intangible Assets Asset Impairment and Restructuring Costs Acquisition Related Expenses Income from Operations Other Income (Expense). Net Earnings before Taxes Income Tax Expense Net Income (Loss) Net Income Attributable to Lululemon Depreciation Expense (in COGS and SG&A) SOURCE: S&P Net Advantage 421.09 1.58 422.67 119.30 303.37 303.37 87.70 819.98 (0.60) 819.38 230.40 588.98 588.98 185.48 Ne Co Gre Sel Net Inco Othe Inter Earr Incon Net I Net In Net In Depre SOURC Lululemon Athletica Inc. (NasdaqGS:LULU) Balance Sheet Balance Sheet as of: Jan-29-2017 Jan-28-2018 Feb-03-2019 Feb-02-2020 Jan-31-202 USD USD USD USD USD Currency Units Millions Millions Millions Millions Millions 1.150 62 Current Assets Cash and Cash Equivalents Accounts Receivables Inventories Prepaid Expenses & Other Current Assets Prepaid and Receivable Income Taxes Total Current Assets. Operating I ease Right-of-use Assets Property and Equipment, net Deferred Income Taxes Goodwill Intangible Assets Net Other Non-current Assets Total Assets Current Liabilities Accounts Pavable. Other Accrued liabilities Accrued Inventory Purchases Accrued Compensation and Related Expenses Income Taxes Pavable. Unredeemed Gift Card Liability Other Current Liabilities Current Lease Liabilities Total Current Liabilities Noncurrent Operating Lease Liabilities Deferred Income Taxes Noncurrent Income Taxes Pavable Other Non-current Liabilities Total Liabilities Shareholders' Equity Common Stock - Par Value Additional Paid in Capital Retained Earnings Accumulated Other Comprehensive Income foss) Total Shareholders Equity Total Liabilities & Shareholders Equitv SOURCE SAP Net Artvantage 734.8 92 298 4 39.1 81.2 1.162.7 423.5 26.3 24.5 01. 20.5 1.657.5 24.8 A6 55.2 30.3 70.5 52.6 242.0 7.3 0 48.3 297.6 06 266.6 1.294.2 (2015) 1.360.0 1.657.5 990.5 192 329.6 48.1 48.9 1.436.3 473,6 32.5 24 6 0.1 31.4 1.998.5 24.6 13.0 70.1 15.7 82.7 86.4 292.6 1.3 48.3 59.3 401.5 06 284.3 1.455.0 (142 9) 1.597.0 1.998.5 881.3 35.8 404 8 57.9 49.4 1.429.3 567.2 26.5 24.2 0 37.4 2.084.7 95.5 16.2 109.2 67.4 99 4 112.7 500.5 14.2 42.1 81.9 638.7 06 315.3 1.346.9 1216 A) 1.446.0 2.084.7 1.093.5 402 518.5 70.5 85.2 1.807.9 689.7 671.7 31.4 24.2 02 56.2 3.281.4 80.0 112.6 6.3 133.7 26.4 120.4 12.4 128.5 620.4 611.5 43.4 48 2 5.6 1.329.1 06 355.5 1.820.6 (2245) 1.952.3 3.281.4 647 125.1 139.1 2.124.4 734 8 745.7 6.7 386.9 80.1 106.6 4.185.2 172.2 2119 15.0 130.2 8.4 155 8 23.6 166.1 883.2 632.6 58.8 432 9.0 1,626.6 06 388.7 2.346.4 (177.21 2.558.5 4.185.2 8 0 98 98 48 Income Statement 12 12 months 12 months months 12 months 12 months For the Fiscal Perlod Ending Dec-31- Dec-31- Dec-31- Dec-31- Dec-31- 2016 2017 2018 2019 2020 Currency USD USD USD USD USD Units Millions Millions Millions Millions Millions 2.377.05 2.466.11 2.802.33 3.042.48 2.501.55 1.266.70 1.306.10 1.416.00 1.526.80 1.277.70 1.110.35. 1.160.01 1.386.33 1.515.68 1.223.85 864.10 910.90 1.051 20 1.136.20 1.098.90 15.49 10.24 13.90 15.79 12.11 394.97 137.06 2.16 2.04 8.30 0.44 Net Sales Cost of Sales Gross Profit Sellina General and Administrative Expenses Net Licensina Income Income from Operations Other Non-operating Income (Expense). Net Interest Income. Net Earnings before Taxes Income Tax Expense Net Income (Loss) Net Income of Non-controlling Interest Net Income Attributable to Columbia Depreciation Expense (in COGS and SG&A) SOURCE: S&P Net Advantage 256.49 (0.60) 1.00 256.89 58.50 198.39 6.50 191.89 60.02 263.01 (0.30) 4.12 266.82 350.91 105.22 59.95 (0.10) 9.88 360.69 154.40 85.80 112.42 274.89 7.20 6.70 268.19 58.23 405.42 74.90 330.52 0.00 330.52 121.73 139.54 31.50 108.04 0.00 108.04 146.60 M D SC Columbia Sportswear Company (NasdaqGS:COLM) Income Statement 12 12 months 12 months For the Fiscal Period Ending Dec-31- Dec-31- months 12 months 12 months Dec-31- Dec-31- Dec-31- 2016 2017 2018 2019 2020 Currency USD USD USD USD USD Units Millions Millions Millions Millions Millions 2.377.05 2.466.11 2.802.33 3.042.48 2.501.55 1.266.70 1.306.10 1.416.00 1.526.80 1.277.70 1.110.35 1.160.01 1.386.33 1.515.68 1.223.85 864 10 910.90 1.051.20 1.136.20 1.098.90 10.24 13.90 15.79 15.49 12.11 Net Sales Cost of Sales Gross Profit Sellina General and Administrative Expenses Net Licensina Income Income from Operations Other Non-operating Income (Expense). Net Interest Income. Net Earnings before Taxes Income Tax Expense Net Income (Loss) Net Income of Non-controlling Interest Net Income Attributable to Columbia Depreciation Expense (in COGS and SG&A) SOURCE: S&P Net Advantage 8 18 256.49 (0.60) 1.00 256.89 58.50 198.39 6.50 191.89 60.02 263.01 105.22 350.91 (0.30) 4.12 266.82 154.40 85.80 112.42 274.89 7.20 6.70 59.95 (0.10) 9.88 360.69 268.19 58.23 394.97 2.16 8.30 405.42 74.90 137.06 2.04 0.44 139.54 31.50 108.04 330.52 0.00 0.00 330.52 108.04 121.73 146.60 % % % 5% 1% 0% 7% .6% .0% 8.6% 5.2% 3.4% 13.4% Common Size Income Statement 12 12 months 12 months For the Fiscal Period Ending Dec-31- Dec-31- 12 months 12 months months Dec-31- Dec-31- Dec-31- 2016 2017 2018 2019 2020 Currency USD USD USD USD USD Units Millions Millions Millions Millions Millions Net Sales 100.0% 100.0% 100.0% 100.0% Cost of Sales 53.0% 50.5% 50.2% 51.1% Gross Profit 47.0% 49.5% 49.8% 48.9% 36.9% 37.5% 37,3% 43.9% Sellina. General and Administrative Expenses Net Licensina Income 0.6% 0.6% 0.5% 0.5% Income from Operations 10.7% 12.5% 13.0% 0.0% 0.0% 0.1% Other Non-operatina Income (Expense). Net Interest Income. Net 0.2% 0.4% 0.3% Earnings before Taxes 10.8% 12.9% 13.3% Income Tax Expense 6.3% 3.1% 2.5% Net Income (Loss) 4.6% 9.8% 10.9% Net Income of Non-controlling Interest 0.3% 0.2% 0.0% Net Income Attributable to Columbia 4.3% 9.6% 10.9% 100.0% 53.3% 46.7% 36.4% 0.4% 10.8% 0.0% 0.0% 10.8% 2.5% 8.3% 0.3% 8.1% 5.5% 0.1% 0.0% 5.6% 1.3% 4.3% 0.0% 4.3% O % % 8% 2% 8.7% 8.5% -8.8% Year-over-Year Income Statement 12 12 months 12 months months For the Fiscal Period Ending Dec-31- Dec-31- Dec-31- 12 months 12 months Dec-31- Dec-31- 2017 2018 2019 2020 2016 USD USD USD USD USD Currency Units Millions Millions Millions Millions Millions Net Sales 3.7% 13.6% 8.6% -17.8% Cost of Sales 3.1% 8.4% 7.8% -16.3% Gross Profit 4.5% 19.5% 9.3% -19.3% 5.4% 15.4% 8.1% -3.3% Sellina. General and Administrative Expenses Net Licensina Income 35.7% 13.6% -1.9% -21.8% Income from Operations 2.5% 33.4% 12.6% -65.3% 50.0% 66.7% 2256.0% -5.4% Other Non-operating Income (Expense). Net Interest Income. Net 310.3% 140.0% -15.9% -94.8% Earnings before Taxes 3.9% 35.2% 12.4% -65.6% Income Tax Expense 163.9% -44.4% -12.7% -57.9% Net Income (Loss) -43.3% 144.5% 20.2% -67.3% Net Income of Non-controlling Interest 10.8% -6.9% -100.0% Net Income Attributable to Columbia -45.2% 154.9% 23.2% -8.8% N LI 3 P 1 K D -67.3% C Ir E. In Ne Inc Pa Net L Current Assets Cash and Cash Equivalents Short-term Investments Accounts Receivables Inventories Prepaid Expenses & Other Current Restricted Cash Total Current Assets Operating Lease Right-of-use Assets Property Plant and Fouinment Deferred Income Taxes Goodwill Intangible Assets Net Other Non-current Assets Total Assets Current Liabilities Accounts Pavable Accrued Liabilities 14 Income Taxes Pavable 8 .6 9 [0 2 AND 5.1 3.2 26 RA 132 9.0 6.6 Columbia Sportswear Company (NasdaqGS:COLM) Balance Sheet Balance Sheet as of: Dec-31-2016 Dec-31-2017 Dec-31-2018 Dec-31-2019 Dec-31-2020 Currency USD USD USD USD USD Units Millions Millions Millions Millions Millions 551.4 673.2 437.8 686.0 790.7 0.5 95.0 262.8 1.7 1.2 333.7 364.9 449.4 488.2 452.9 488.0 457.9 521.8 606.0 556.5 38.5 58.6 79.5 93.9 54.2 0 0 14.0 0 0 1.412.0 1.649.5 1.765.3 1.875.7 1.855.6 394.5 339.2 279 7 2814 2916 346.7 309 8 925 56.8 78.2 78 A 96 1 68 6 68 6 68 6 68 6 68 6 133 4 129 6 126.6 123 6 103 6 27.7 27.1 43.7 63.6 2.013.9 2.212.9 2.931.6 2.836.6 215.0 252.3 255.4 206.7 142.2 182.2 295.7 257.3 5.6 19.1 15.8 23.2 64.0 65.5 362.9 453.6 630.9 552.6 14.1 0 0 371 5 353 2 5.2 0.1 64 12.7 49.9 42.6 42.9 0,6 88.7 346.4 77.21 558.5 Tam 185.2 Operating Lease Liabilities Total Current Liabilities Notes Pavable to Related Party Noncurrent Onerating I ease 1 iabilities Deferred Income Taxes Noncurrent Income Taxes Pavable. Other Liabilities Total Liabilities Shareholders' Equitv Common Stock (no par value) Retained Earnings Accumulated Other Comprehensiv Minority Interest Total Shareholders Equity Total Liabilities & Shareholders I SOURCE: S&P Net Advantage 432.4 53.8 1.529.6 (22.6) 20.7 1.581.5 2013.9 0 02 58.1 48.7 560.6 45.8 1.585.0 (8.91 30.3 1.652.2 22129 38.5 2.368.7 274.4 275.7 22.8 572.9 0 95 50-8 45.2 678.4 0 1.677.9 (4.1) 16.5 1.690.3 2.368.7 48 4 24.9 1.082.1 4.9 1.848.9 (4.4) 0 1.849.5 2.931.6 1,003.8 20.2 1.8118 0.8 0 1.832.8 2.836.6 Current. Cash ar Account: Inventori Prepaid Total C Operating Property s Deferred I Goodwill Intangible Other Non Total A Current Lia Accounts P Accrued Ex Customer R Other Curre Operatina Le Revolvina Ci Current Matu Total Curri Long-term De Noncurrent O Other Long-te Total Liab Shareholders' Common Stock Additional Paid Retained Earni Accumulated O Total Shareh Total Liabilities SOURCE: S&P Net D 5 20 11 6 04 44 54 1.50 .04 0.00 8.04 46.60 Under Armour, Inc. (NYSE:UAA) Income Statement 12 months 12 months 12 months 12 months 12 months For the Fiscal Period Ending Dec-31- Dec-31- Dec-31- Dec-31- Dec-31- 2017 2018 2019 2020 Currency 2016 USD Millions USD USD USD USD Units Millions Millions Millions Millions 4.833.34 4.989.24 5.193.19 5.267.13 4.474.67 2.584.70 2.737.80 2.852.70 2.796.60 2.314.60 2.248.64 2.251.44 2.340.49 2.470.53 2.160.07 1.831.10 2.099.50 2.182.30 2.233.80 2.171.90 0.00 124.00 183.10 0.00 601.60 27.94 (24.91) 236.73 (613.43) (3.60) (9.20) (5.70) 168.15 (34.50) (33.60) (21.20) (47.30) (10.16) (67.71) 38.00 (20.55) 70.00 (48.16) (47.16) 139.83 0.00 0.93 (47.70) 0.00 92.13 186.43 Net Revenues Cost of Goods Sold Gross Profit Sellina. General and Administrative Expenses Restructuring & Impairment Charges Income from Operations Other Income (Expense). Net Interest Expense. net Earnings before Taxes Income Tax Expense (Benefit) Net Income (Loss) Income (Loss) from Eauitv Method Investment Payment to Class C Shareholders Net Income Attributable to Under Armour Depreciation Expense (in COGS and SG&A) SOURCE: S&P Net Advantage 417.54 (2.80) (26.40) 388.34 131.30 257.04 0.00 (59.00) 198.04 144.77 0.00 (48.16) 173.75 0.00 (46.23) 181.77 209.83 (492.58) 49.40 (541.98) (7.20) 0.00 (549.18) 164.98 O / % % 5% 1% 0% 5.6% 13% 4.3% 0.0% Common Size Income Statement 12 months 12 months 12 months 12 months 12 months For the Fiscal Period Ending Dec-31- Dec-31- Dec-31- Dec-31- Dec-31- 2017 2018 2019 2020 2016 USD USD USD USD USD Currency Units Millions Millions Millions Millions Millions. Net Revenues 100.0% 100.0% 100.0% Cost of Goods Sold 54.9% 53.1% 51.7% Gross Profit 45.1% 46.9% 48.3% Sellina. General and Administrative Expenses 42.0% 42.4% 48.5% Restructurina & Impairment Charaes 3.5% 0.0% 13.4% Income from Operations -0.5% 4.5% -13.7% Other Income (Expense). Net -0.2% 3.8% Interest Expense, net -0.6% Earnings before Taxes -1.3% -0.4% Income Tax Expense (Benefit) -0.9% Net Income (Loss) 0.0% Income (Loss) from Equity Method Investment Payment to Class C Shareholders 0.0% -0.9% Net Income Attributable to Under Armour 4.3% 100.0% 53.5% 46.5% 37.9% 0.0% 8.6% -0.1% -0.5% 8.0% 2.7% 5.3% 0.0% -1.2% 4.1% 100.0% 54.9% 45.1% 42.1% 2.5% 0.6% -0.1% -0.7% -0.2% 0.8% -1.0% 0.0% 0.0% -1.0% -0.1% -0.4% -1.1% 4.0% -11.0% 1.3% 1.1% 2.7% -12.1% -0.9% -0.2% 0.0% 0.0% 1.7% -12.3% Net Revenues Cost of Goods Sold Gross Profit Sellina. General and Administrative Expenses Restructurina & Impairment Charges Income from Operations Other Income (Expense). Net Interest Expense. net Earnings before Taxes Income Tax Expense (Benefit) Net Income (Loss) Income (Loss) from Equity Method Investments Payment to Class C Shareholders Net Income Attributable to Under Armour % % 5% Year-over-Year Income Statement 12 months 12 months 12 months 12 months 12 months For the Fiscal Period Ending Dec-31- Dec-31- Dec-31- Dec-31- Dec-31- 2016 2017 2018 2019 2020 USD USD Currency USD USD USD Units Millions Millions Millions Millions Millions -15.0% -17.2% -12.6% -2.8% 9% .3% 7.3% 4.1% 4.2% 4.0% 3.9% 3.2% 5.9% 0.1% 14.7% -93.3% -189.2% -28.6% -155.6% -30.7% 2.6% -102.6% -566.7% -71.1% -154.1% -118.7% 2.1% -124.3% 4.0% 1.4% -2.0% 5.6% 2.4% 1050.2% -359.1% 38.0% 3050.1% 36.9% -123.1% 409.9% -334.7% 440.6% -29.4% 396.5% -487.6% 299.3% -696.1% Current Assets Cash and Cash Equivalents Accounts Receivables Inventories Prepaid Expenses & Other Current/ Total Current Assets Operating Lease Right-of-use Assets Property and Fouinment net Deferred Income Taxes Goodwill Intangible Assets. Net Other Non-current Assets Total Assets Current Liabilities Accounts Pavable Accrued Expenses Customer Refund liabilities Other Current Liabilities Operating Lease Liabilities Revolving Credit Facility Current Maturities of Long-term Deb, Total Current Liabilities 1 ona-term Debl Noncurrent Operating Lease Liabilities Other long-term 1 iabilities Total Liabilities Shareholders' Equity Common Stock - Par Value Additional Paid in Capital ( Retained Farminas Accumulated Other Comprehensive Total Shareholders Equity Total Liabilities & Shareholders E 7 3.2 $5.5 52 6 0 353.2 5.2 49.9 42 9 003.8 Under Armour, Inc. (NYSE:UAA) Balance Sheet Balance Sheet as of: Dec-31-2016 Dec-31-2017 Dec-31-2018 Dec-31-2019 Dec-31-2020 Currency USD USD USD USD USD Units Millions Millions Millions Millions Millions 250.5 312.5 557.4 788.1 1.5174 622.7 609.7 652.5 708.7 527.3 917.5 1.158.5 1.019.5 892.3 896.0 174.5 257.0 364.2 313.2 282.3 1.965.2 2.337.7 2.593.6 2.702.2 591.9 8042 885.8 8269 792 1 136.9 82.8 112.4 82.4 563.6 5557 546.5 550.2 64.3 47.0 41.8 36.3 110.2 974 123.8 88.3 3.644 3 4.006.4 4.245.0 4.843.5 409.7 561.1 560.9 618.2 208.8 296.8 340 4 374 7 n 3014 2194 40.4 50.4 88.3 83.8 125.9 0 125.0 0 0 27.0 27.0 25.0 0 685.8 1:060 4 1.316.0 1422 0 790 4 765.0 703 R 592 7 580.6 137.2 1623 208 3 98.1 20.2 1811 R 0.8 0 1.832.8 2.836.6 1.613.4 0.1 823.5 1.259 4 (52.2) 2.030.8 3.6443 1.987.7 0.1 872.3 1.1844 (38.21 2018.7 4.006.4 2.228.2 0.1 916.6 1.139 1 (39.0) 2016.9 4.245.0 2.693.4 0.1 973.7 1.2270 (50,8) 2.150.1 4.8435 3.223.0 536.7 658 7 23.9 502.2 13.3 72.9 5.030.6 576.0 378 9 203 4 92.5 162.6 0 0 1.4133 1,003 6 839 4 3.354.6 0.2 1.061.2 673 9 (59.2) 1.676.0 5.030.6 1. Take a look at the year-over-year income statement. How have the three companies been performing over time in terms of revenue and income growth? 2. Take a look at the common size income statement and the profitability ratios. How have the three companies been performing over time in terms of profitability? 3. Take a look at the asset management ratios and the common size balance sheet. How well have the three companies been managing their assets? 4. Take a look at the liquidity ratios, debt ratios, and common size balance sheet. How are the companies doing with respect to being able to pay their debts
