

Question
lululemon Performance test Calculate: 1.From 2011 through 2015, lululemons compound average growth rate in net revenues was______. 2.Lulus income from operations rose from ___ million
lululemon Performance test
Calculate:
1.From 2011 through 2015, lululemons compound average growth rate in net revenues was______.
2.Lulus income from operations rose from ___ million in fiscal 2011 to ____ million in fiscal 2015, an increase of _____ and a compound average growth rate of ______.
3.Lulus net income rose from _____ million in fiscal 2011 to ______ million in fiscal 2015, an increase of _____ and a compound average growth rate of _________.
4.Lulu's diluted net income per share rose from _____ in 2011 to ______ in 2015, an increase of ______% and a compound average growth rate of ______. 5. Lululemon has financed its rapid growth during the 2011-2015 period without incurring burdensome debt, as reflected by its _____ million in total debt and capital lease obligations versus ______ billion in stockholders equity at the end of fiscal 2015 and its very modest annual interest expenses throughout 2011-2015
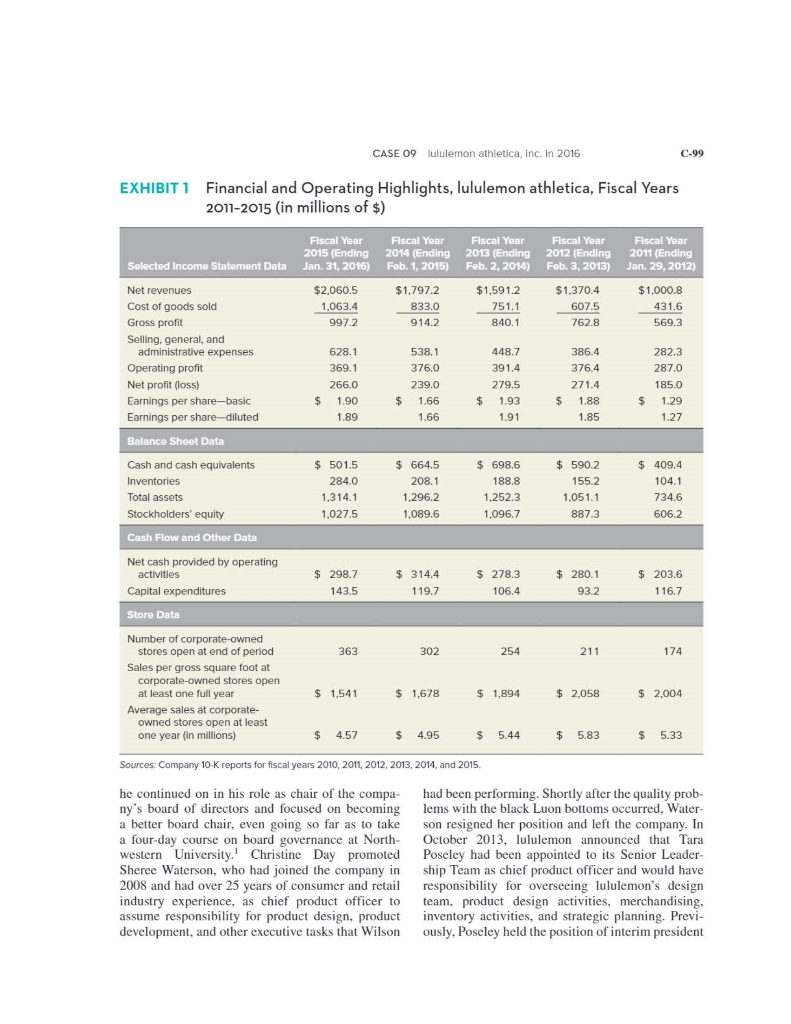
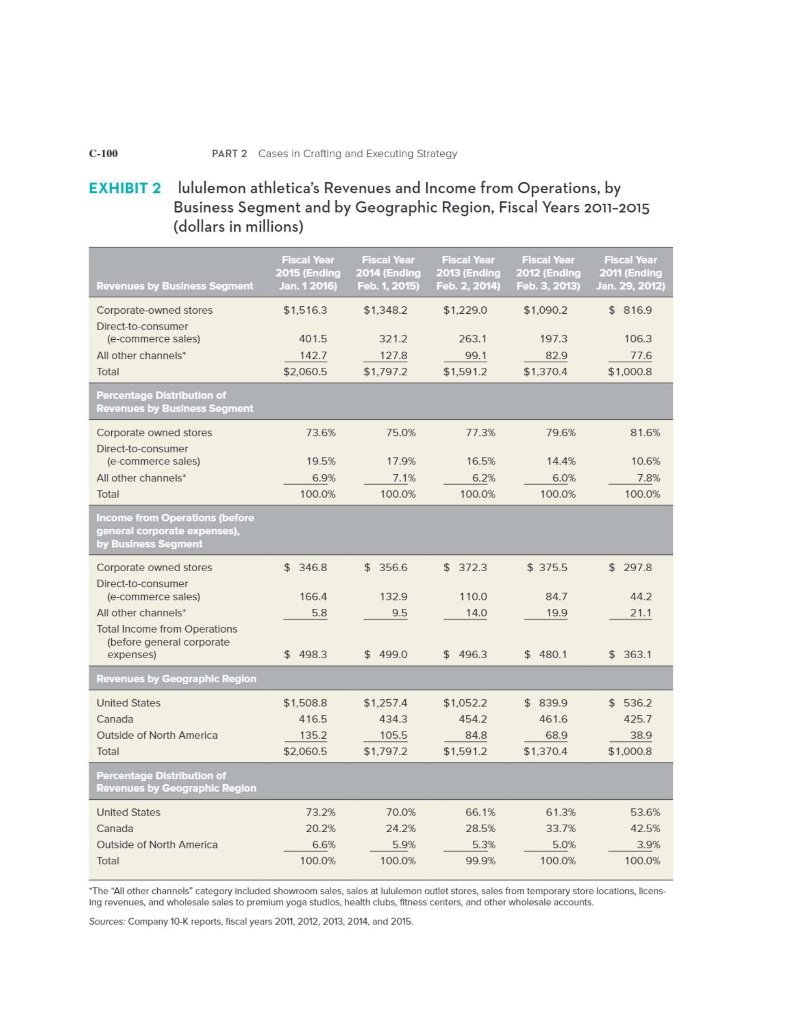
CASE 09 lululemon athletica, inc. in 2016 C-99 EXHIBITI Financial and Operating Highlights, lululemon athletica, Fiscal Years 2011-2015 (in millions of $) Fiscal Year 2015 (Ending Jan. 31, 2016) Fiscal Year 2014 (Ending Feb. 1, 2015) Fiscal Year 2013 (Ending Feb. 2, 2014) Fiscal Year 2012 (Ending Feb. 3, 2013) Fiscal Year 2011 (Ending Jan. 29, 2012) Selected Income Statement Data $2,060.5 1.063.4 997.2 $1.797.2 833.0 914.2 $1,591.2 751.1 840.1 $1,370.4 607.5 762.8 $1,000.8 431.6 569.3 Net revenues Cost of goods sold Gross profit Selling, general, and administrative expenses Operating profit Net profit (loss) Earnings per share-basic Earnings per share-diluted 628.1 369.1 266.0 1.90 1.89 538.1 376.0 239.0 1.66 1.66 448.7 391.4 279.5 1.93 1.91 386.4 376.4 271.4 1.88 1.85 282.3 287.0 185.0 1.29 1.27 $ $ $ $ $ Balance Sheet Data Cash and cash equivalents Inventories Total assets Stockholders' equity Cash Flow and Other Data $ 501.5 284.0 1.314.1 1,027. 5 $ 664.5 208.1 1.296.2 ,089.6 $ 698.6 188.8 1,252.3 1,096.7 $ 590.2 155.2 1.051.1 887. 3 $ 409.4 104.1 734.6 6 06.2 1 Net cash provided by operating activities Capital expenditures $ 298.7 143.5 $ 314.4 119.7 $ 278.3 106.4 $ 280.1 93.2 $ 203.6 116.7 Store Data 363302254211174 Number of corporate-owned stores open at end of period Sales per gross square foot at corporate-owned stores open at least one full year Average sales at corporate- owned stores open at least one year in millions) $ 1,541 $ 1,678 $ 1,894 $ 2,058 $ 2,004 $ 4.57 $ 4.95 $ 5.44 $ 5.83 $ 5.33 Sources: Company 10-K reports for fiscal years 2010, 2011, 2012, 2013, 2014, and 2015. he continued on in his role as chair of the compa- ny's board of directors and focused on becoming a better board chair, even going so far as to take a four-day course on board governance at North- western University. Christine Day promoted Sheree Waterson, who had joined the company in 2008 and had over 25 years of consumer and retail industry experience, as chief product officer to assume responsibility for product design, product development, and other executive tasks that Wilson had been performing. Shortly after the quality prob- lems with the black Luon bottoms occurred, Water- son resigned her position and left the company. In October 2013, lululemon announced that Tara Poseley had been appointed to its Senior Leader- ship Team as chief product officer and would have responsibility for overseeing lululemon's design team, product design activities, merchandising, inventory activities, and strategic planning. Previ- ously, Poseley held the position of interim president C-100 PART 2 Cases in Crafting and Executing Strategy EXHIBIT 2 lululemon athletica's Revenues and Income from Operations, by Business Segment and by Geographic Region, Fiscal Years 2011-2015 (dollars in millions) Fiscal Year 2015 (Ending Jan. 1 2016) Fiscal Year 2014 (Ending Feb. 1, 2015) Fiscal Year 2013 (Ending Feb. 2, 2014) Fiscal Year 2012 (Ending Feb. 3, 2013) Fiscal Year 2011 (Ending Jan. 29, 2012) Revenues by Business Segment $1,516.3 $1,348.2 $1,229.0 $1,090.2 $ 816.9 Corporate-owned stores Direct-to-consumer (e-commerce sales) All other channels Total 401.5 142.7 $2,060.5 321.2 127.8 $1,797.2 263.1 99.1 $1,591.2 197.3 82.9 $1,370.4 106.3 77.6 $1,000.8 Percentage Distribution of Revenues by Business Segment 73.6% 75.0% 77.3% 79.6% 81.6% Corporate owned stores Direct-to-consumer (e-commerce sales) All other channels Total 19.5% 6.9% 100.0% 17.9% 7.1% 100.0% 16.5% 6.2% 100.0% 14.4% 6.0% 100.0% 10.6% 7.8% 100.0% Income from Operations (before general corporate expenses), by Business Segment $ 346.8 $ 356.6 $ 372.3 $ 375.5 $ 297.8 110.0 Corporate owned stores Direct-to-consumer (e-commerce sales) All other channels Total Income from Operations (before general corporate expenses) 166.4 5.8 132.9 9.5 84.7 19.9 44.2 21.1 - 14.0 _ $ 498.3 $ 499.0 $ 496.3 $ 480.1 $363.1 Revenues by Geographic Region 330 United States Canada Outside of North America Total $1,508.8 416.5 135.2 $2,060.5 $1,257.4 434.3 105.5 $1,797.2 $1,052.2 454.2 84.8 $1,591.2 $ 839.9 461.6 68.9 $1.370.4 $ 536.2 425.7 38.9 $1.000.8 Percentage Distribution of Revenues by Geographic Region United States Canada Outside of North America Total 73.2% 20.2% 6.6% 100.0% 70.0% 24.2% 5.9% 100.0% 66.1% 28.5% 5.3% 99.9% 61.3% 33.7% 5.0% 100.0% 53.6% 42.5% 3.9% 100.0% "The "All other channels category included showroom sales, sales at lululemon outlet stores, sales from temporary store locations, licens ing revenues, and wholesale sales to premium yoga studios, health clubs, fitness centers, and other wholesale accounts Sources: Company 10-K reports, fiscal years 2011, 2012, 2013, 2014, and 2015
Step by Step Solution
There are 3 Steps involved in it
Step: 1

Get Instant Access to Expert-Tailored Solutions
See step-by-step solutions with expert insights and AI powered tools for academic success
Step: 2

Step: 3
Ace Your Homework with AI
Get the answers you need in no time with our AI-driven, step-by-step assistance
Get Started
Rigos Primer Series CPA Exam Review Financial Accounting Questions And Answers
Authors: Mr. James J. Rigos
2020 Edition
979-8642293720