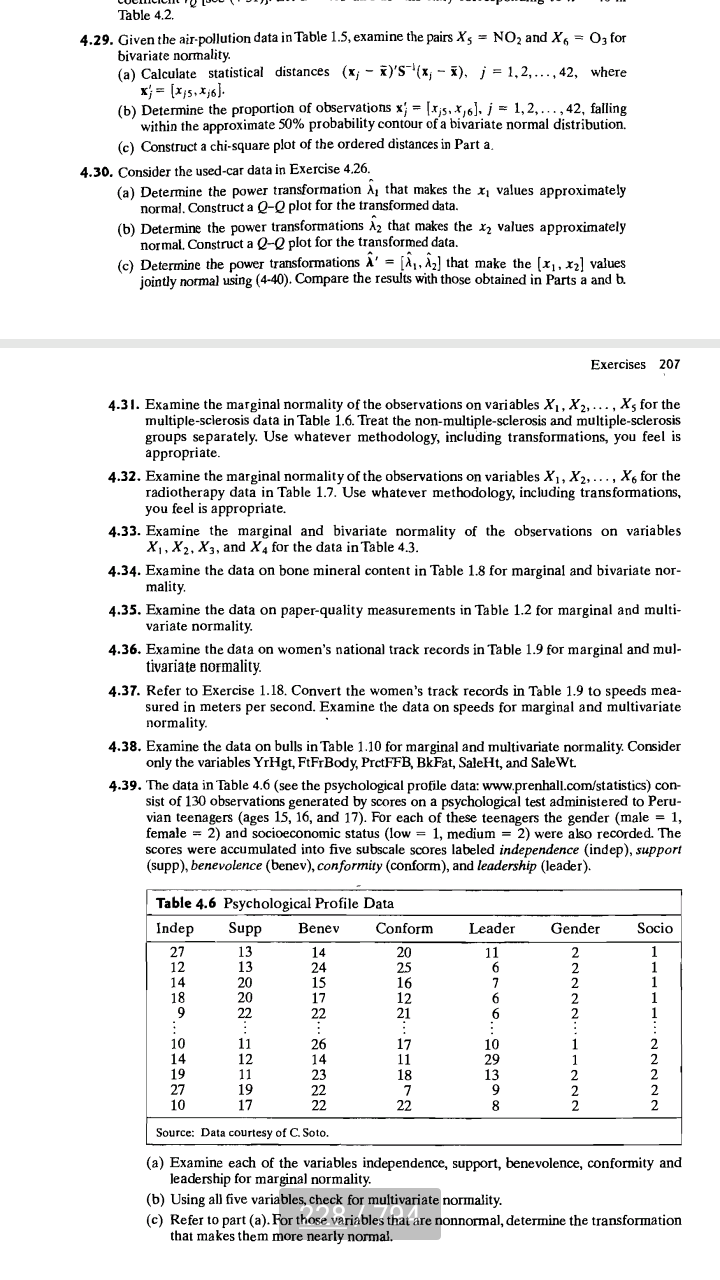
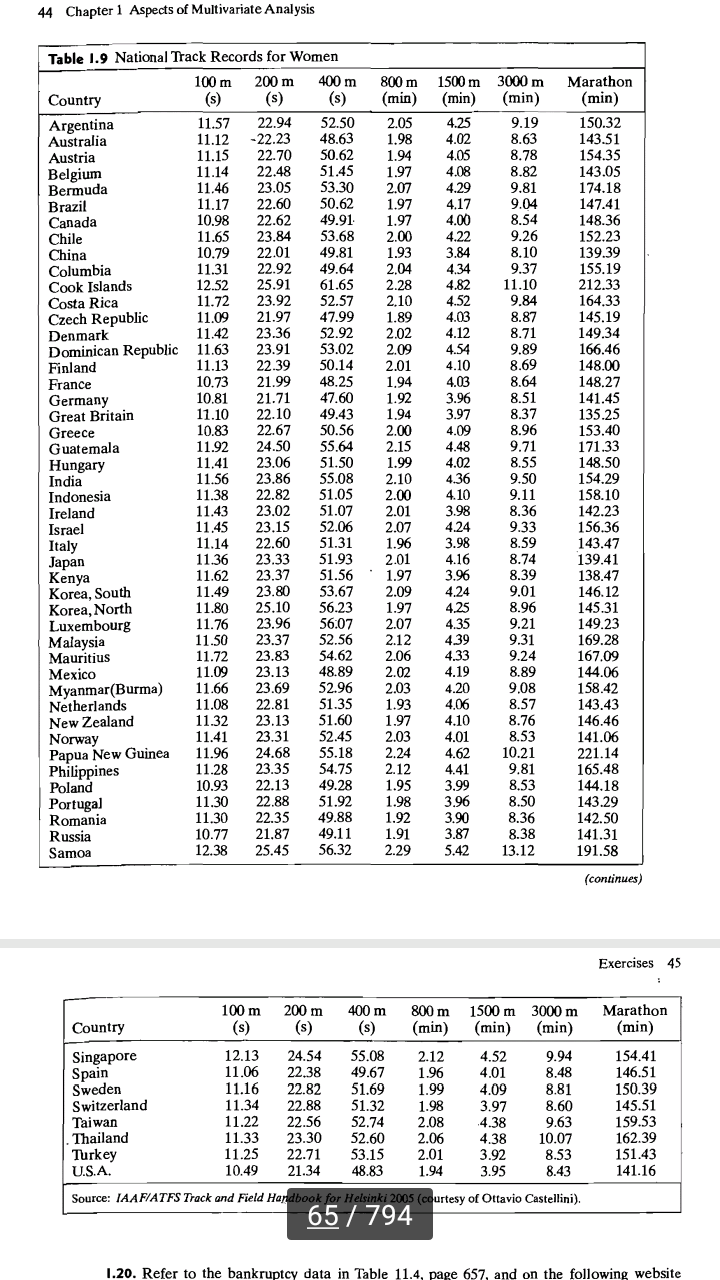
Luwua-alwu .2 LM \\- \"'U' u -- - -- -- ---_, '"r"'\""-= . r. 7- ... Table 4.2. 4.2!. Given the air-pollution data in'I'able 1.5.eramine the pairs X5 5 N03 and Xe = 03 for hivatiat'e mutuality. (a) Calnllate statistical distances (s,- - ifsI'll; i)' j =1.3..--.42, where '}= [Irwin]- (h) Determine the proportion of observations it} = [xj5.x:5]. j 2 1,2,\" -.4?-. faning within the approximate 50% probability contour of a bivariate normal distribution. (:1 Construct a chi-square plot of the ordered distances in Part a. 4.10. Consider the used-oar data in Exercise 4.26. {a} Determine the power transformation A; that unites the r; values approximately normal.Constmcta QQ plat for the transformed data. (b) Determine the power trarnformations A: that makes the x: values approximately normaL Construct a {2-9 plot for the transiormad thta. (o) Determine the poorer trarofot'mtiom 11' '= [111.111] that make the [1:1,le values joinymnnal using (4-40). Compare the results withthose obtained in Parts at and b. Exercises 20? 4.3 I. Examine the marginal normality of the observations on variables X1, X2. . . . . X5 for the multiplesderosis data in Table 1.6 "heat the non-multiplesolerosis and multiple-selerosis groups separately. Use whatever methodolosl', including transformations. you feel is appropriate. 4.3:. Examine the marginal normality of the observations on variables X, , X1, . . . . X5 tor the radiotherapy data in Table 1.7. Use whatever methodology, including transformatiora, you teal is appropriate 4.33- Examine the marginal and bivariate normality of the observations on variables X..X1,X3.and X4 farthe datain'lhblestj. 4.34. Examine the data on bone miners] content in Table 1.3 for marginal and bivariate. nor- mality. 4.35. Examine the data on paper-quality measurements in Table 1.2 for marginal and molti~ variate normality. 4.36. Examine the data on women's national track records in'Iable 1.9 for marginal and mu]- tivariate normality. 4.3L Refer to Exercise 1.13. Convert the women's track reoords inTable 1.9 to speeds mea- sured in meters per second. Examine the data on speeds for marginal and multivariate normality. ' 4.38. Examine the data on bulls in'ITahle 1.10 for marginal and multivariate normality. Consider only the variables Yngt. FtFrEody. PrctFFlEL BszI. Salel-lt, and SaleWt. 4.39. The data in'Iable 4.6 {see the psychological prole data: www.menhalleomistatistim} eon- sist of 130 observations generated by aoores on a psychological test administered to Peru- vian teenagers {ages 15. 16. and 1?). For each of iese teenagers the gender {male = 1, female = 2) and sodooconornjc states (low = 1I medium = 2) were also reDOrdeti. The scores were accumulated into ve subscale scores labeled independence {indop}, support (supp), benevolence (benevl. conformity (conform). and leadership (leader). Table 4.6 Psychological Prole Data indep Supp Benev Conform Source: Dela oounesy of C. Soto. [a] Examine ead'l of the variables independence, support, bemvolenoe, conformity and loadership for marginal normality: (b) Using all ve on '. [e]. Refettopattia). ' thatmaltesthem .. normality. .u- - m - aLdetermine the transformation 2?.8 3' F94 44 Chapter 1 Aspects of MultivarialeAnalysis Table I3 National Ttactk Records for Women 200 m (5) Argentina Australia Austria Belgium Bermuda Brazil Canada Chile China Columbia Coo]: Islands Costa Rica Caech Republic Great Britain Greece G uat emala Hungary India Indonesia Ireland Israel Ital},I Japan Kenya Korea, South Korea, North Luxembourg Malaysia Maurius Mexico Myanmarmurma] Netherlands New Zealand Norway Papua New Guinea 100 m (5} 11:01:11 211161 12.13 11.06 11.16 11.34 11.22 11.33 11.25 10.49 f794 (S) 24. 54 22.38 22.32 22.88 22.56 23.30 22.71 21.34 400 m (5) 80011: 15111111 30011111 Marathon {Min} (min) (min) (mill) Exercises 45 400m 300m 1500m (min) 55.03 49.67 51. 69 51. 32 52 .14 52.60 53.15 43.33 1.96 1.99 1.98 2.08 2 .06 2.01 1. 94 (min) 4.52 4 .01 4.09 3.9? 4 33 4 .38 3 .92 3 .95 (min) 9.94 3.48 3.31 3.60 9.63 10.0? 3.53 3.43 3W\": Mmthon (min) 154.41 146.51 150.313I 145.51 1.59.53 1.62.39 151.43 141.16 LID. Refer to the hankmmcv data in Table 11.4. mm: 65?. and on the following website