

Question
Lyndia Company is a merchandiser that sells a total of 15 products to its customers. The company provided the following information from last year: Product
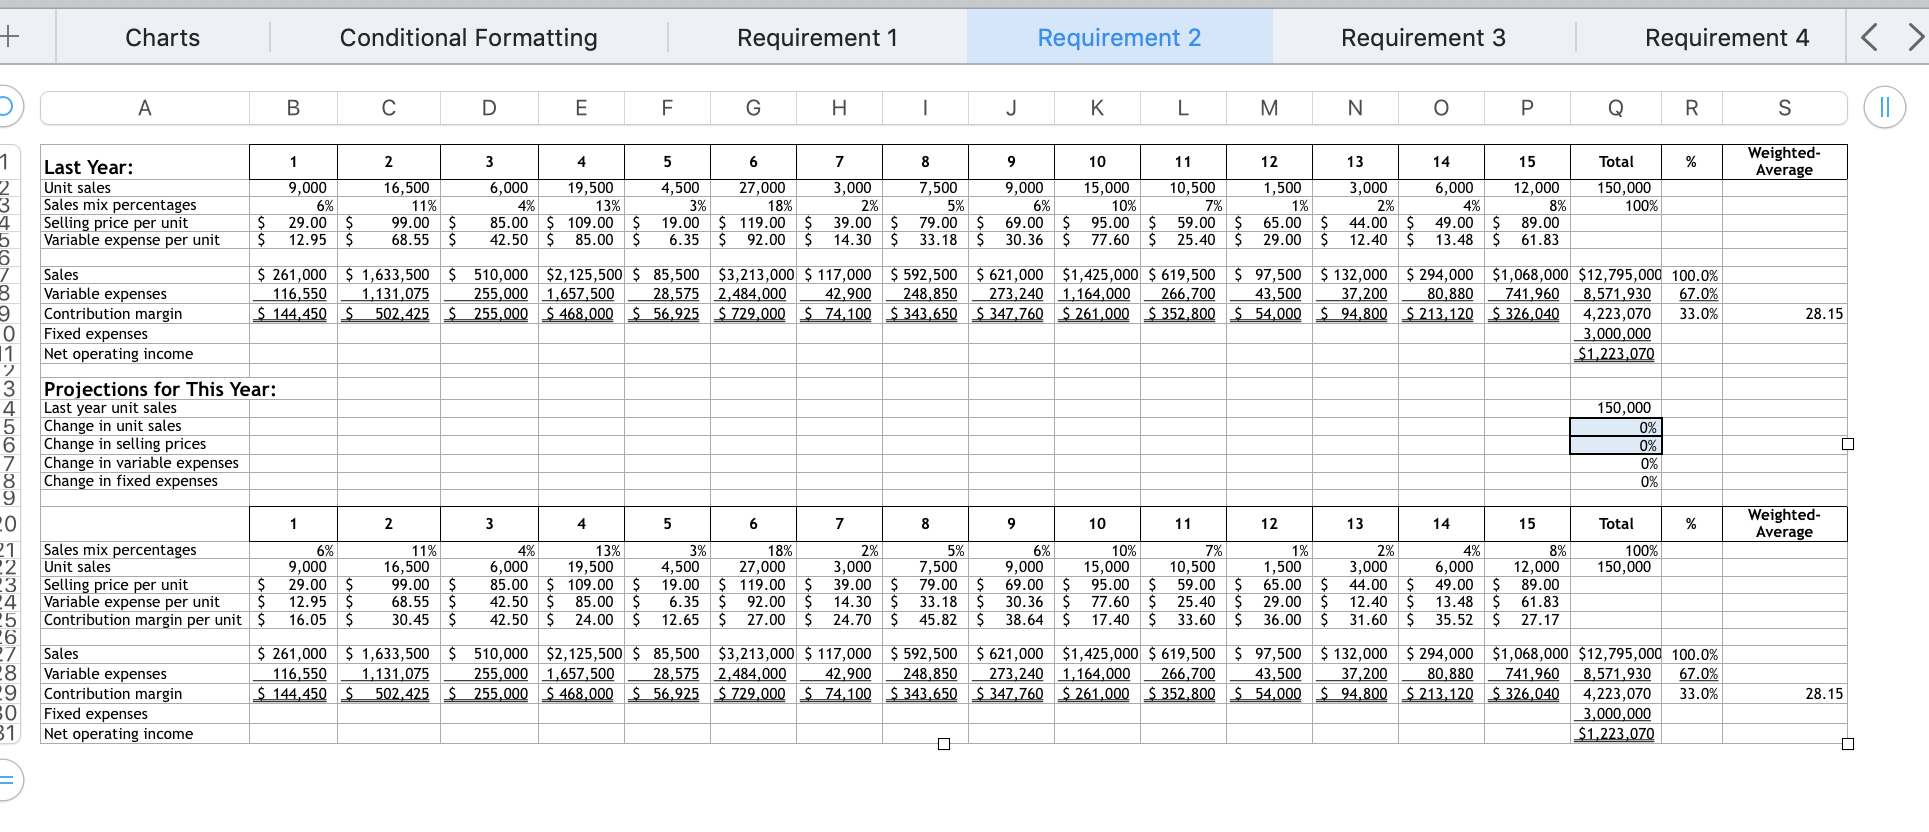 Lyndia Company is a merchandiser that sells a total of 15 products to its customers. The company provided the following information from last year:
| Product | Unit Sales | Selling Price per Unit | Variable Cost per Unit | ||||||
| 1 | 9,000 | $ | 29 | $ | 12.95 | ||||
| 2 | 16,500 | $ | 99 | $ | 68.55 | ||||
| 3 | 6,000 | $ | 85 | $ | 42.50 | ||||
| 4 | 19,500 | $ | 109 | $ | 85.00 | ||||
| 5 | 4,500 | $ | 19 | $ | 6.35 | ||||
| 6 | 27,000 | $ | 119 | $ | 92.00 | ||||
| 7 | 3,000 | $ | 39 | $ | 14.30 | ||||
| 8 | 7,500 | $ | 79 | $ | 33.18 | ||||
| 9 | 9,000 | $ | 69 | $ | 30.36 | ||||
| 10 | 15,000 | $ | 95 | $ | 77.60 | ||||
| 11 | 10,500 | $ | 59 | $ | 25.40 | ||||
| 12 | 1,500 | $ | 65 | $ | 29.00 | ||||
| 13 | 3,000 | $ | 44 | $ | 12.40 | ||||
| 14 | 6,000 | $ | 49 | $ | 13.48 | ||||
| 15 | 12,000 | $ | 89 | $ | 61.83 | ||||
| 150,000 | |||||||||
Last year, Lyndias total fixed expenses and net operating income were $3,000,000 and $1,223,070, respectively. The company would like your assistance in developing some financial projections for this year. Click here to download the Excel template, which you will use to answer the questions that follow.
Click here for a brief tutorial on Goal Seek in Excel.
Click here for a a brief tutorial on Charts in Excel.
Click here for a brief tutorial on Conditional Formatting in Excel.
rev: 05_07_2020_QC_CS-210952
6. Assume the company believes it can increase profits by shifting the sales mix away from products with the highest selling prices and toward the products with the highest contribution margins per unit. To accomplish this goal, the company plans to begin paying sales commissions based on total contribution margin rather than total sales. It also plans to adjust its advertising expenditures to better support the new sales mix strategy. The company hopes these actions will increase the sales mix percentages of the products with the four highest contribution margins per unit by 2% per product. The company also expects a 2% drop in the sales mix percentages of the four products with the highest selling prices. (Hint: Before proceeding, go to row 21 of the spreadsheet and input the 2% increase or decrease for each of the eight affected products, using Conditional Formatting.)
a. If the companys sales mix shifts as just described and it sells a total of 150,000 units, what would be the projected sales for this year? How does this amount compare to the sales from last year?
b. If the companys sales mix shifts as just described and it sells a total of 150,000 units, what net operating income will it earn this year? How does the projected net operating income for this year compare to the sales from last year?
c. Why does the contribution margin ratio shown in cell R29 differ from the contribution margin ratio shown in cell R9?
Goal Seek:
Goal Seek is a tool within Microsoft Excel that performs a "what-if analysis" that enables you to learn what input values would be needed to achieve a desired goal or outcome.
When utilizing Goal Seek you should proceed as follows:
- Under the Data tab click on the What-If Analysis" drop down in the Forecast section
- From that drop down select "Goal Seek"
- A "Goal Seek" option box will appear with three values to be manipulated
- The first input is Set cell which is the cell with linked formulas that you want to change to a specific outcome. Here you will select the specified outcome cell or type in the cell value manually.
- The second input is To value which is the desired goal or outcome that you want the cell you selected in the first input to be changed to. For example, if you want to break even, you could set this value to 0 or if you wanted profit of $5,000 you could input 5000.
- The third and final input is By changing cell is the cell that contains the variable you want to change that is linked to the formulaic output cell that was chosen in the Set cell input
- Click OK
- Now the Set cell should have been modified to the To value you chose as well as the cell value that you designated as the By changing cell variable.
Step by Step Solution
There are 3 Steps involved in it
Step: 1

Get Instant Access to Expert-Tailored Solutions
See step-by-step solutions with expert insights and AI powered tools for academic success
Step: 2

Step: 3
Ace Your Homework with AI
Get the answers you need in no time with our AI-driven, step-by-step assistance
Get Started
Financial management theory and practice
Authors: Eugene F. Brigham and Michael C. Ehrhardt
13th edition
1439078106, 111197375X, 9781439078105, 9781111973759, 978-1439078099