Answered step by step
Verified Expert Solution
Question
1 Approved Answer
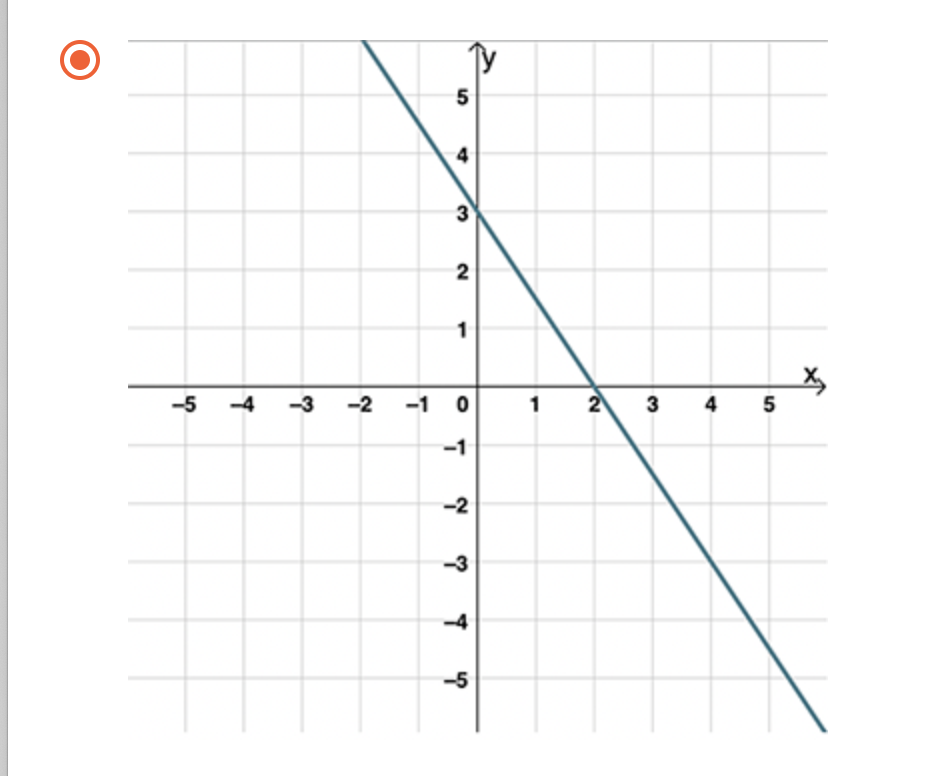
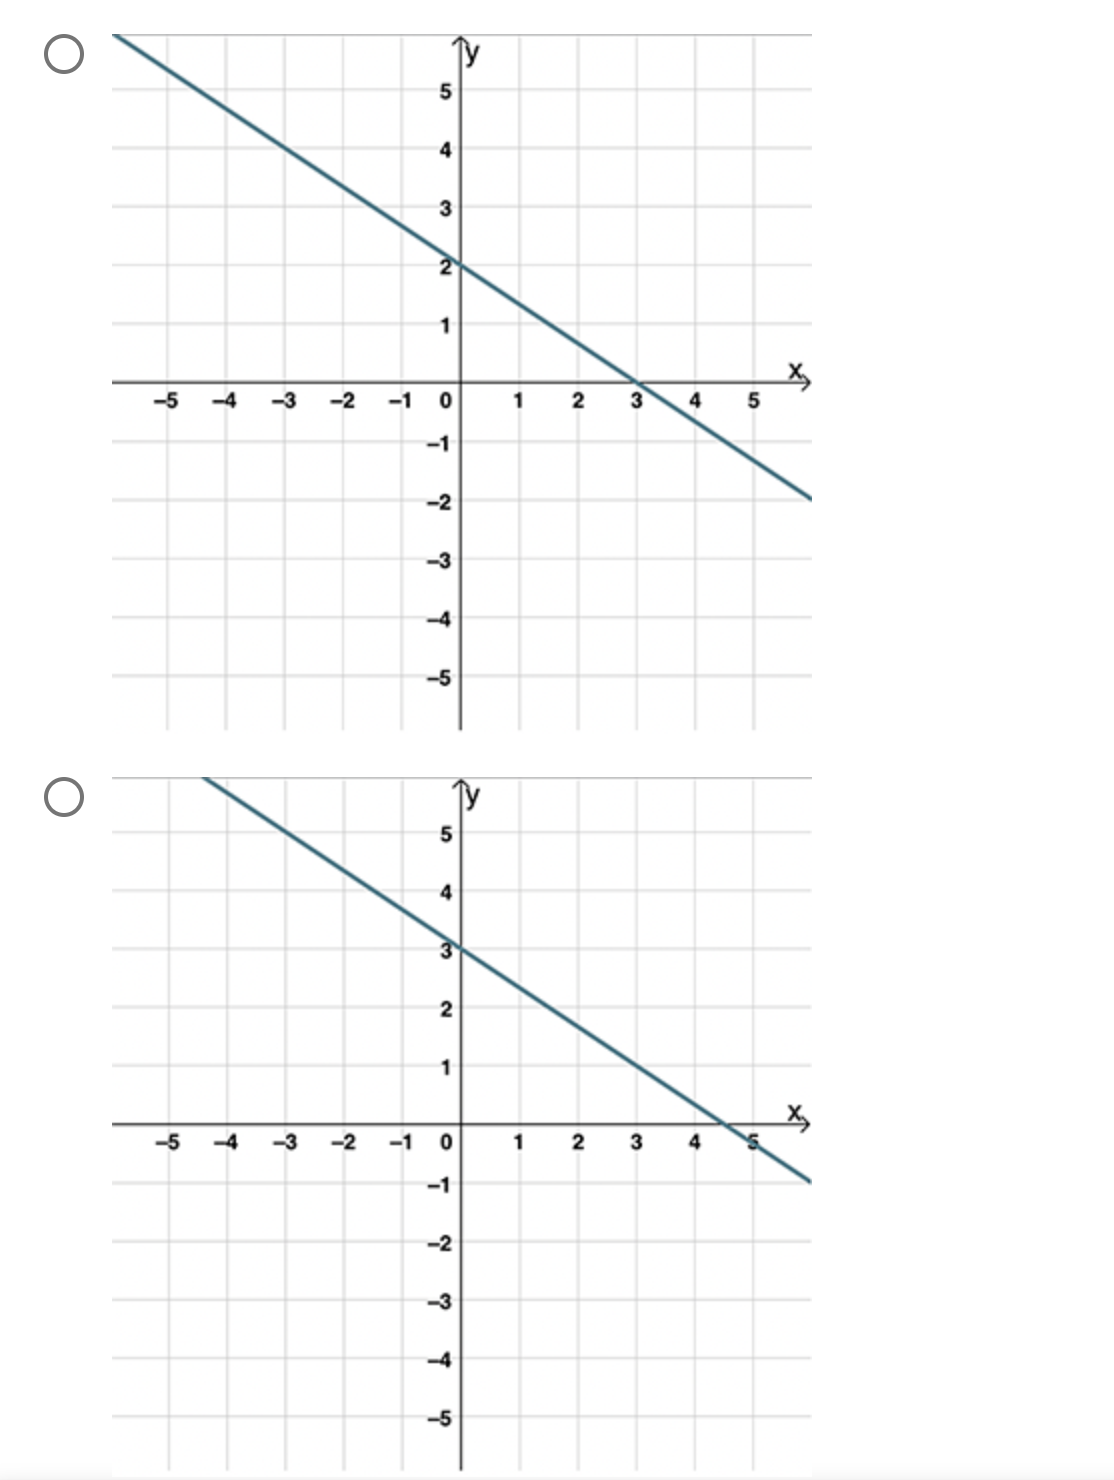
m D 1. (Graphing Linear Equations LC) Which of the following graphs has a slope of -3 and a yintercept of 2? (2 points) 2
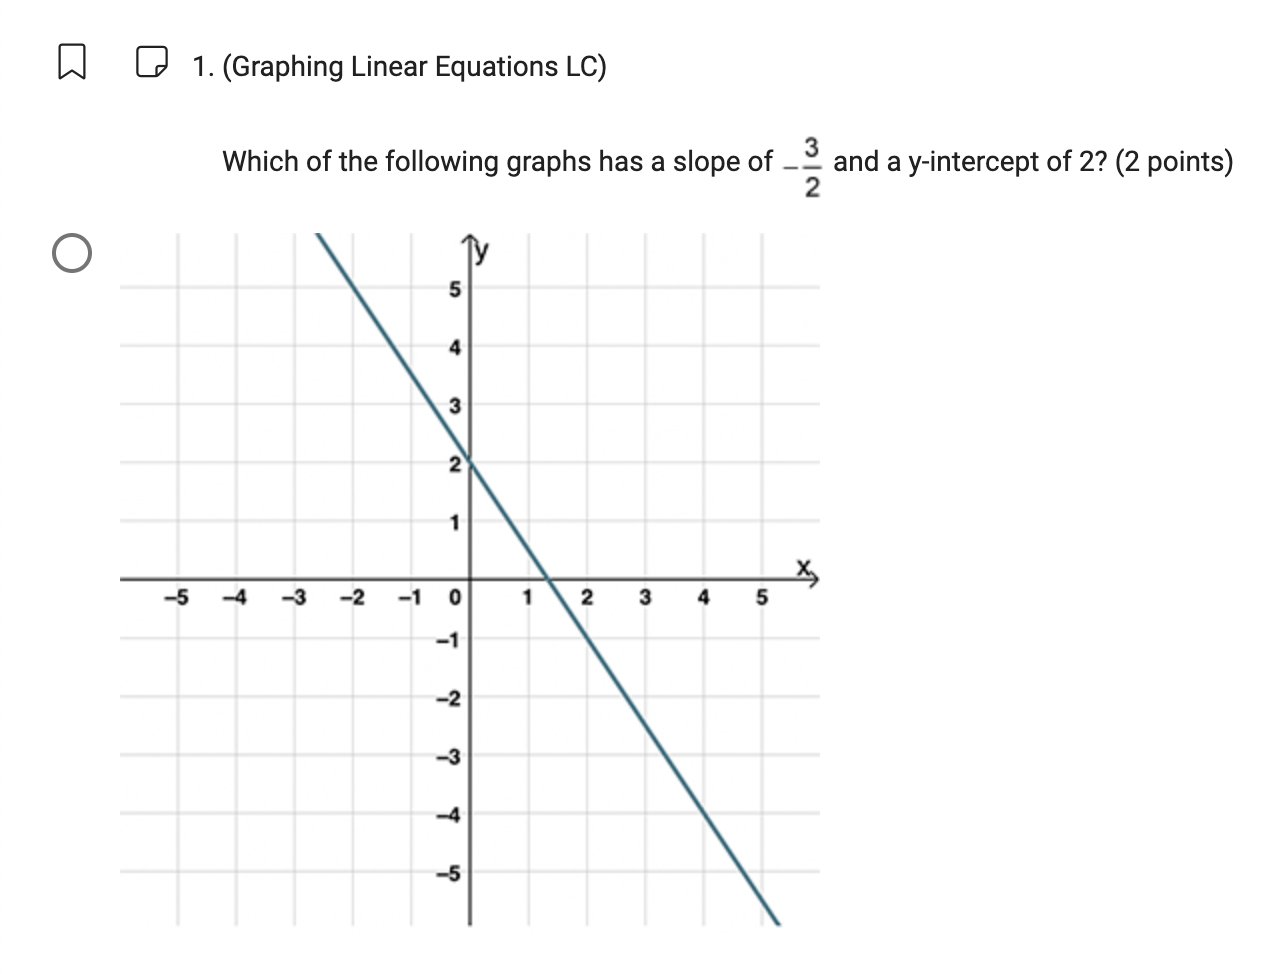
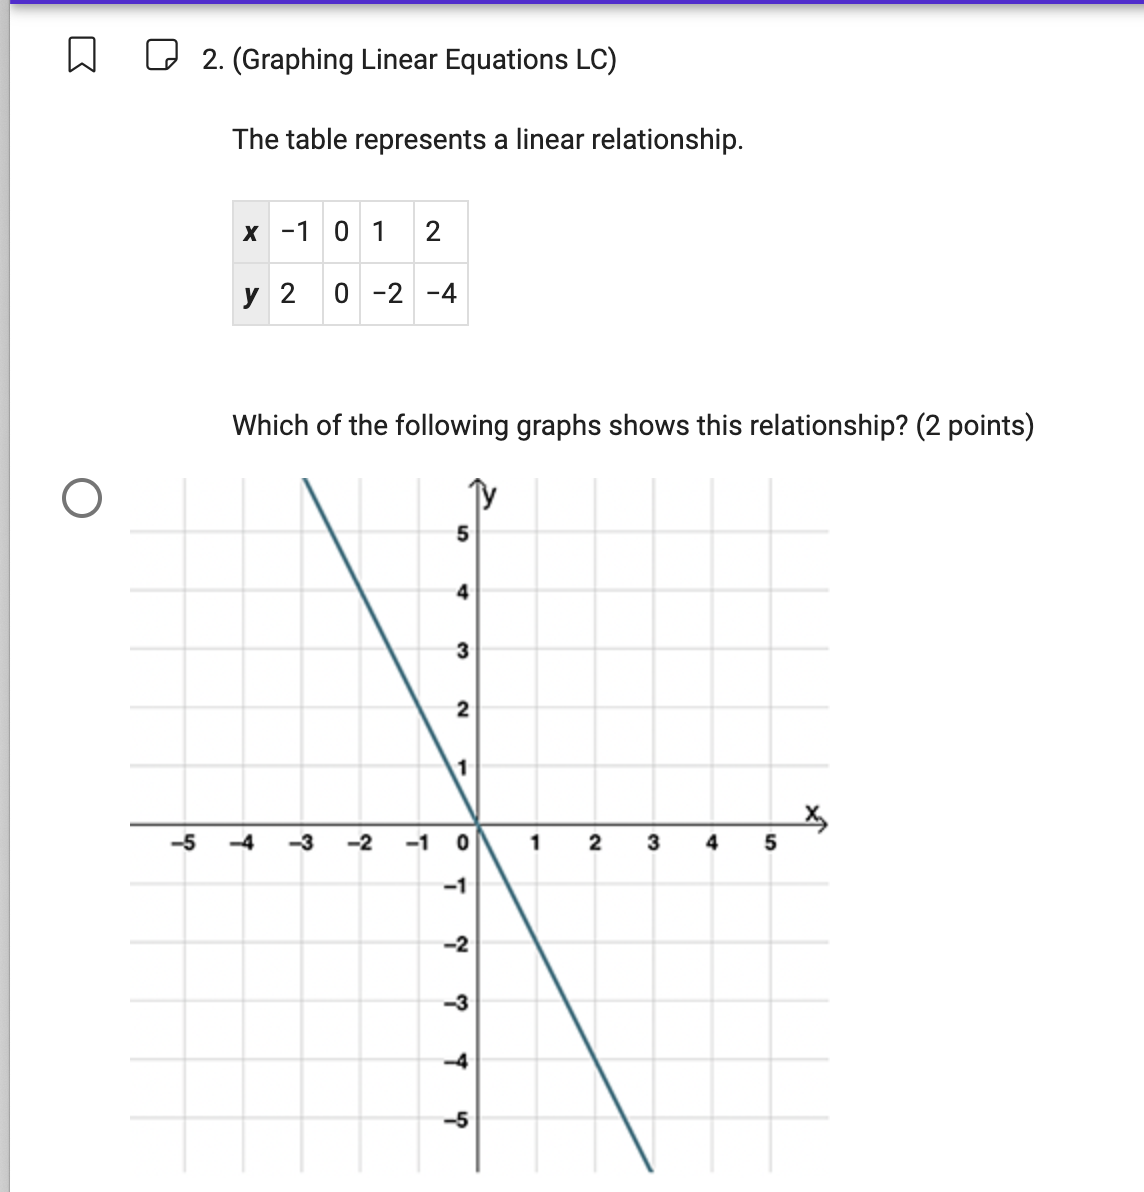
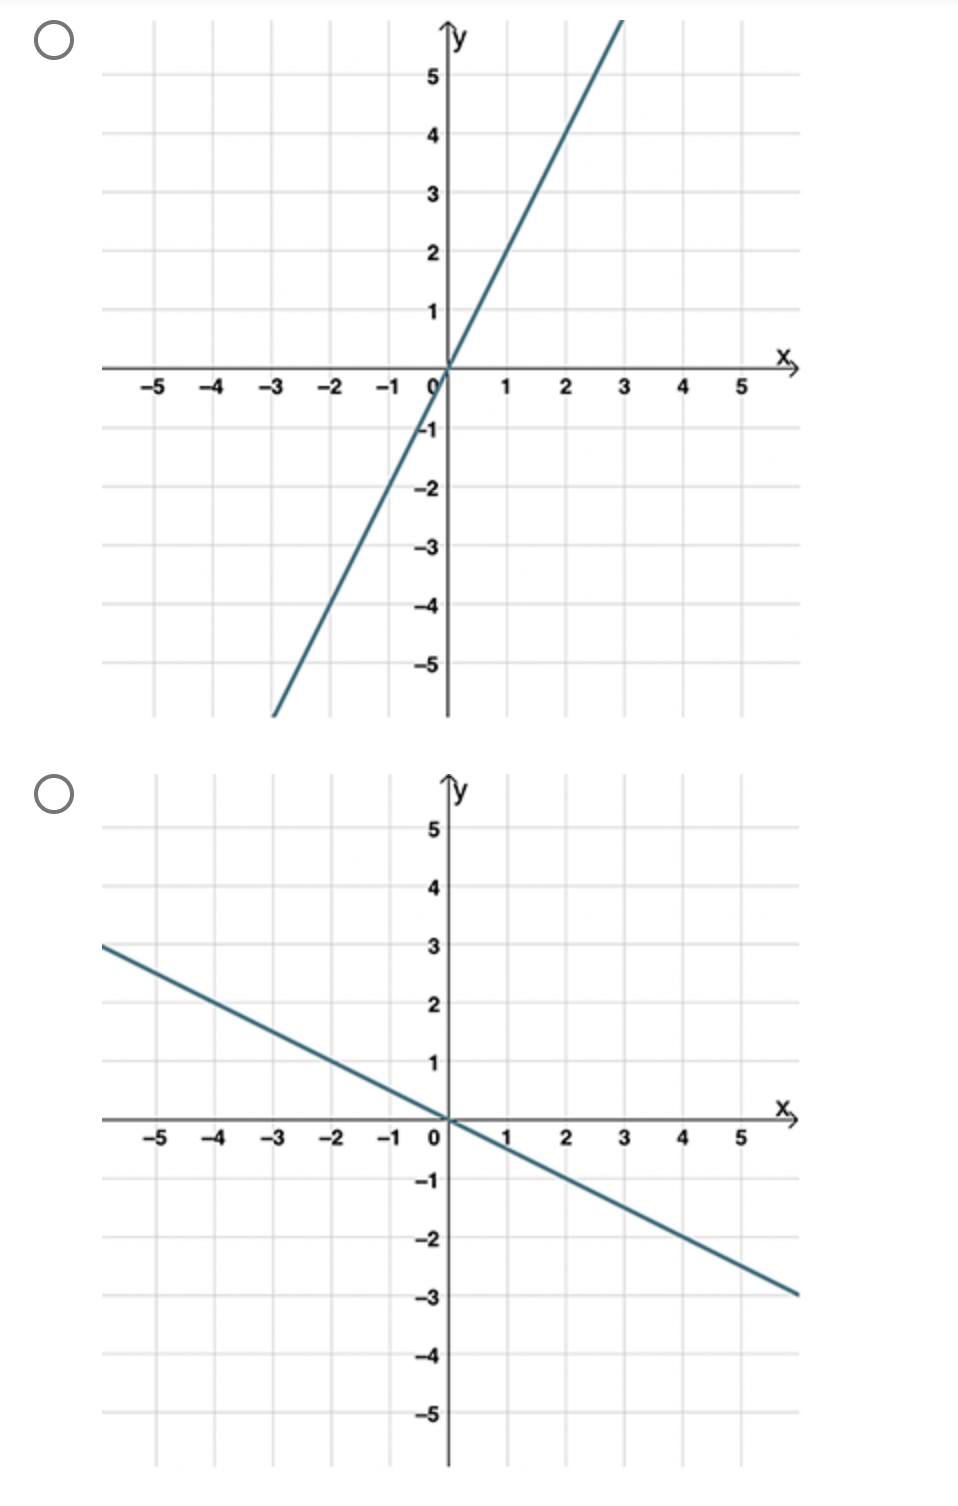
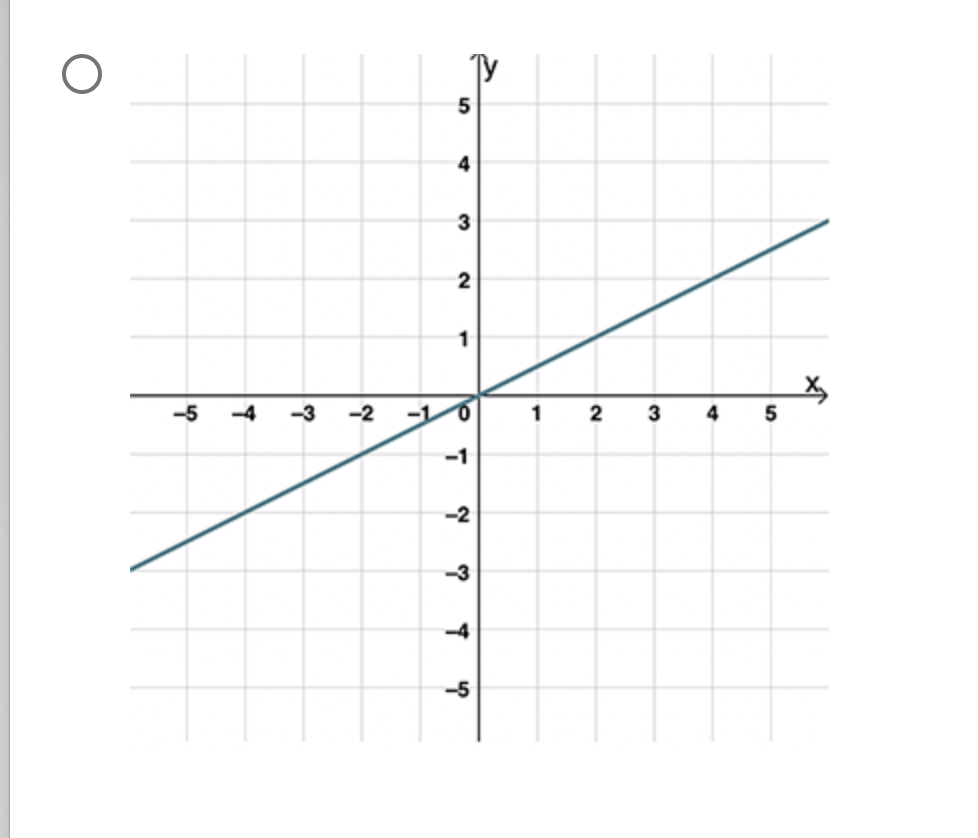
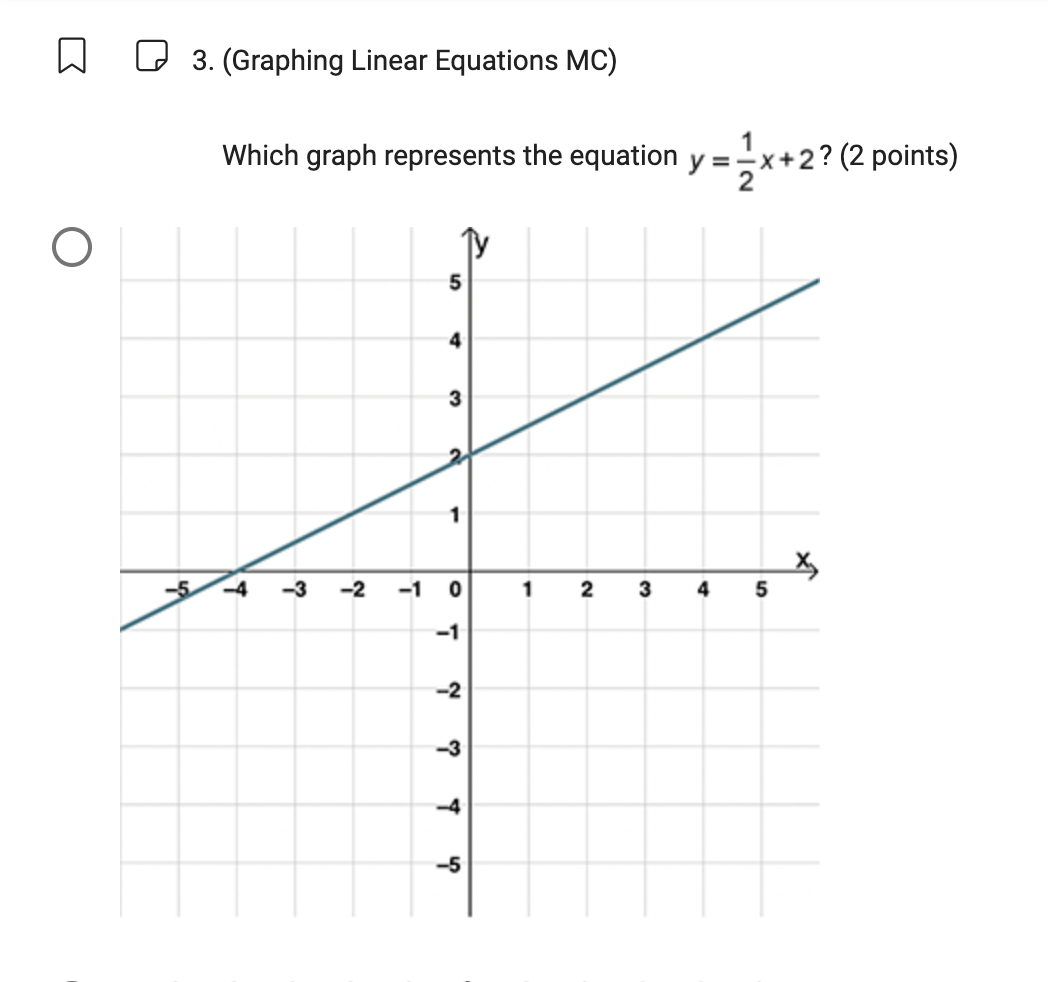
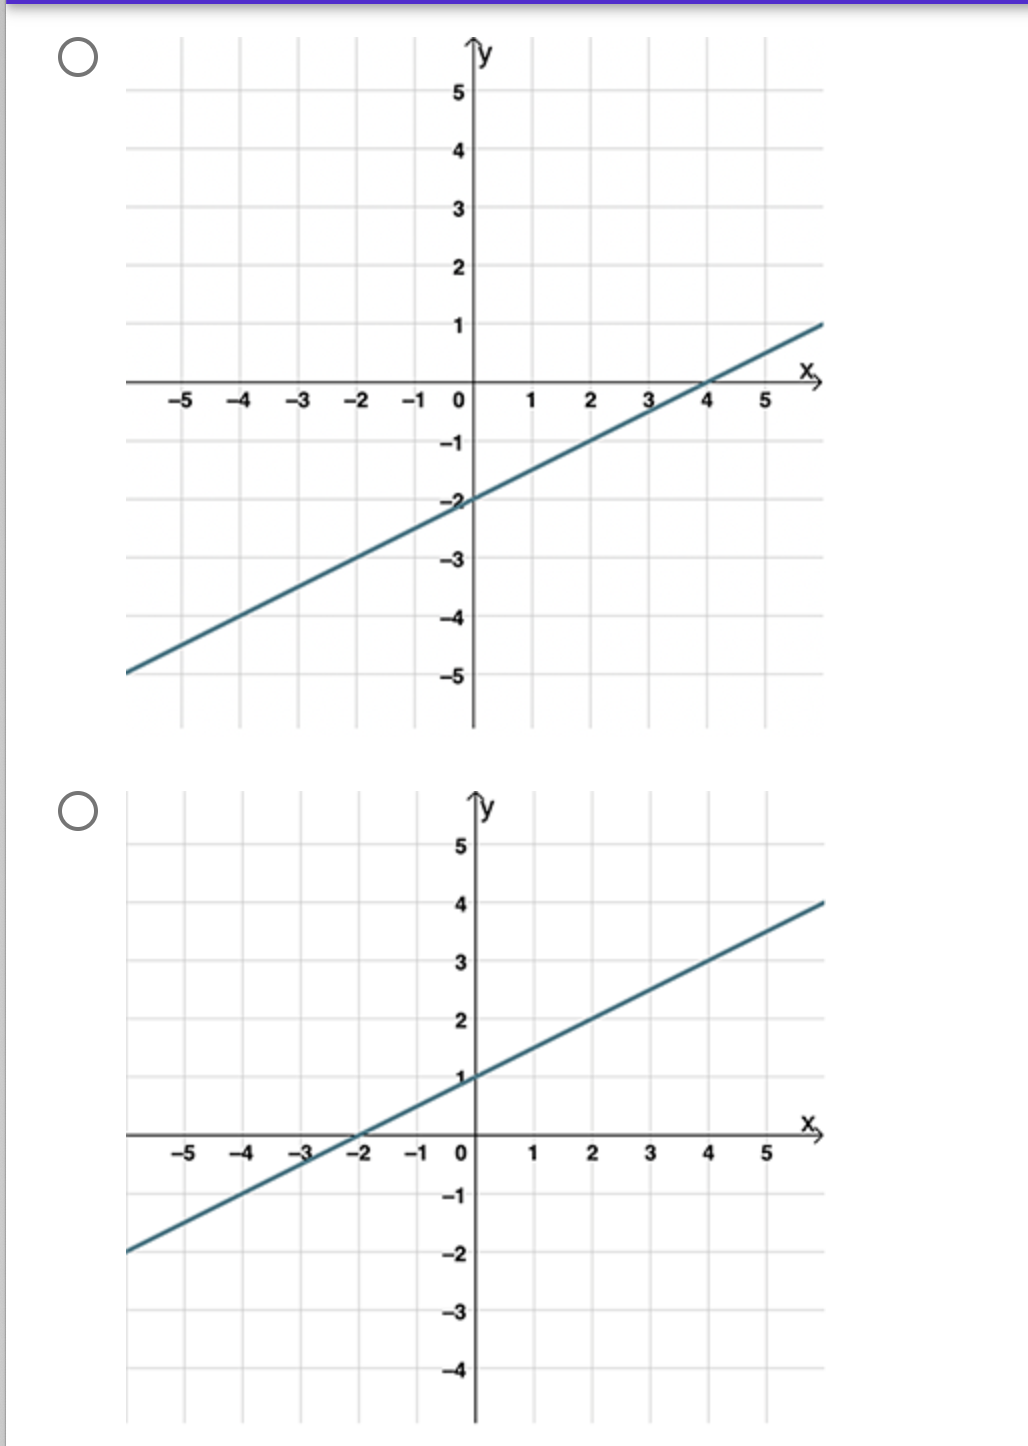
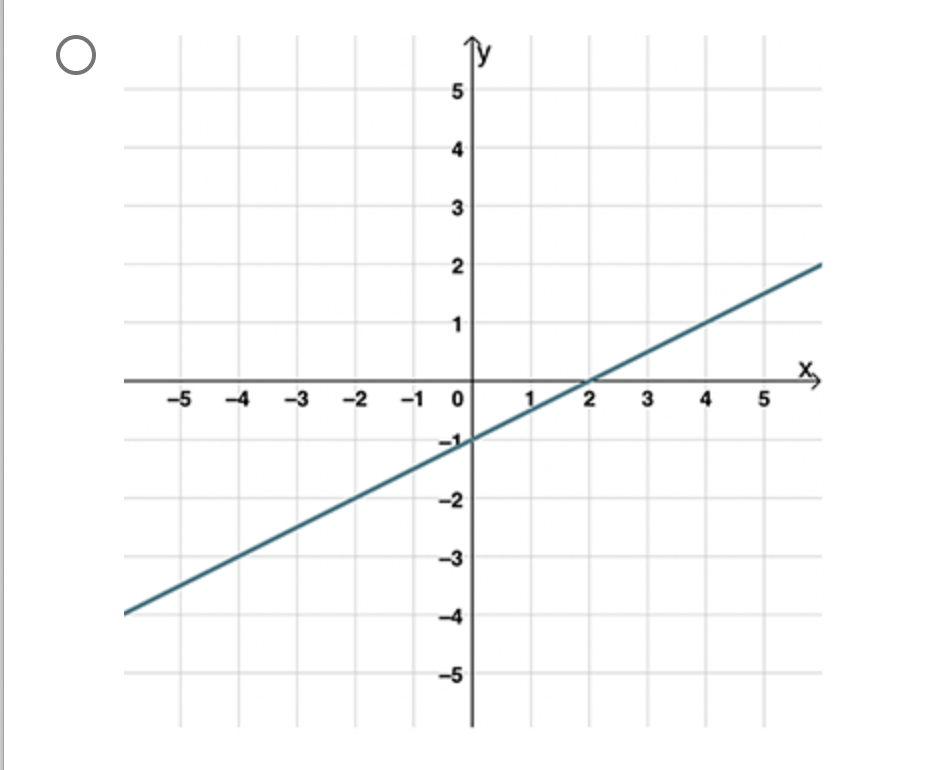
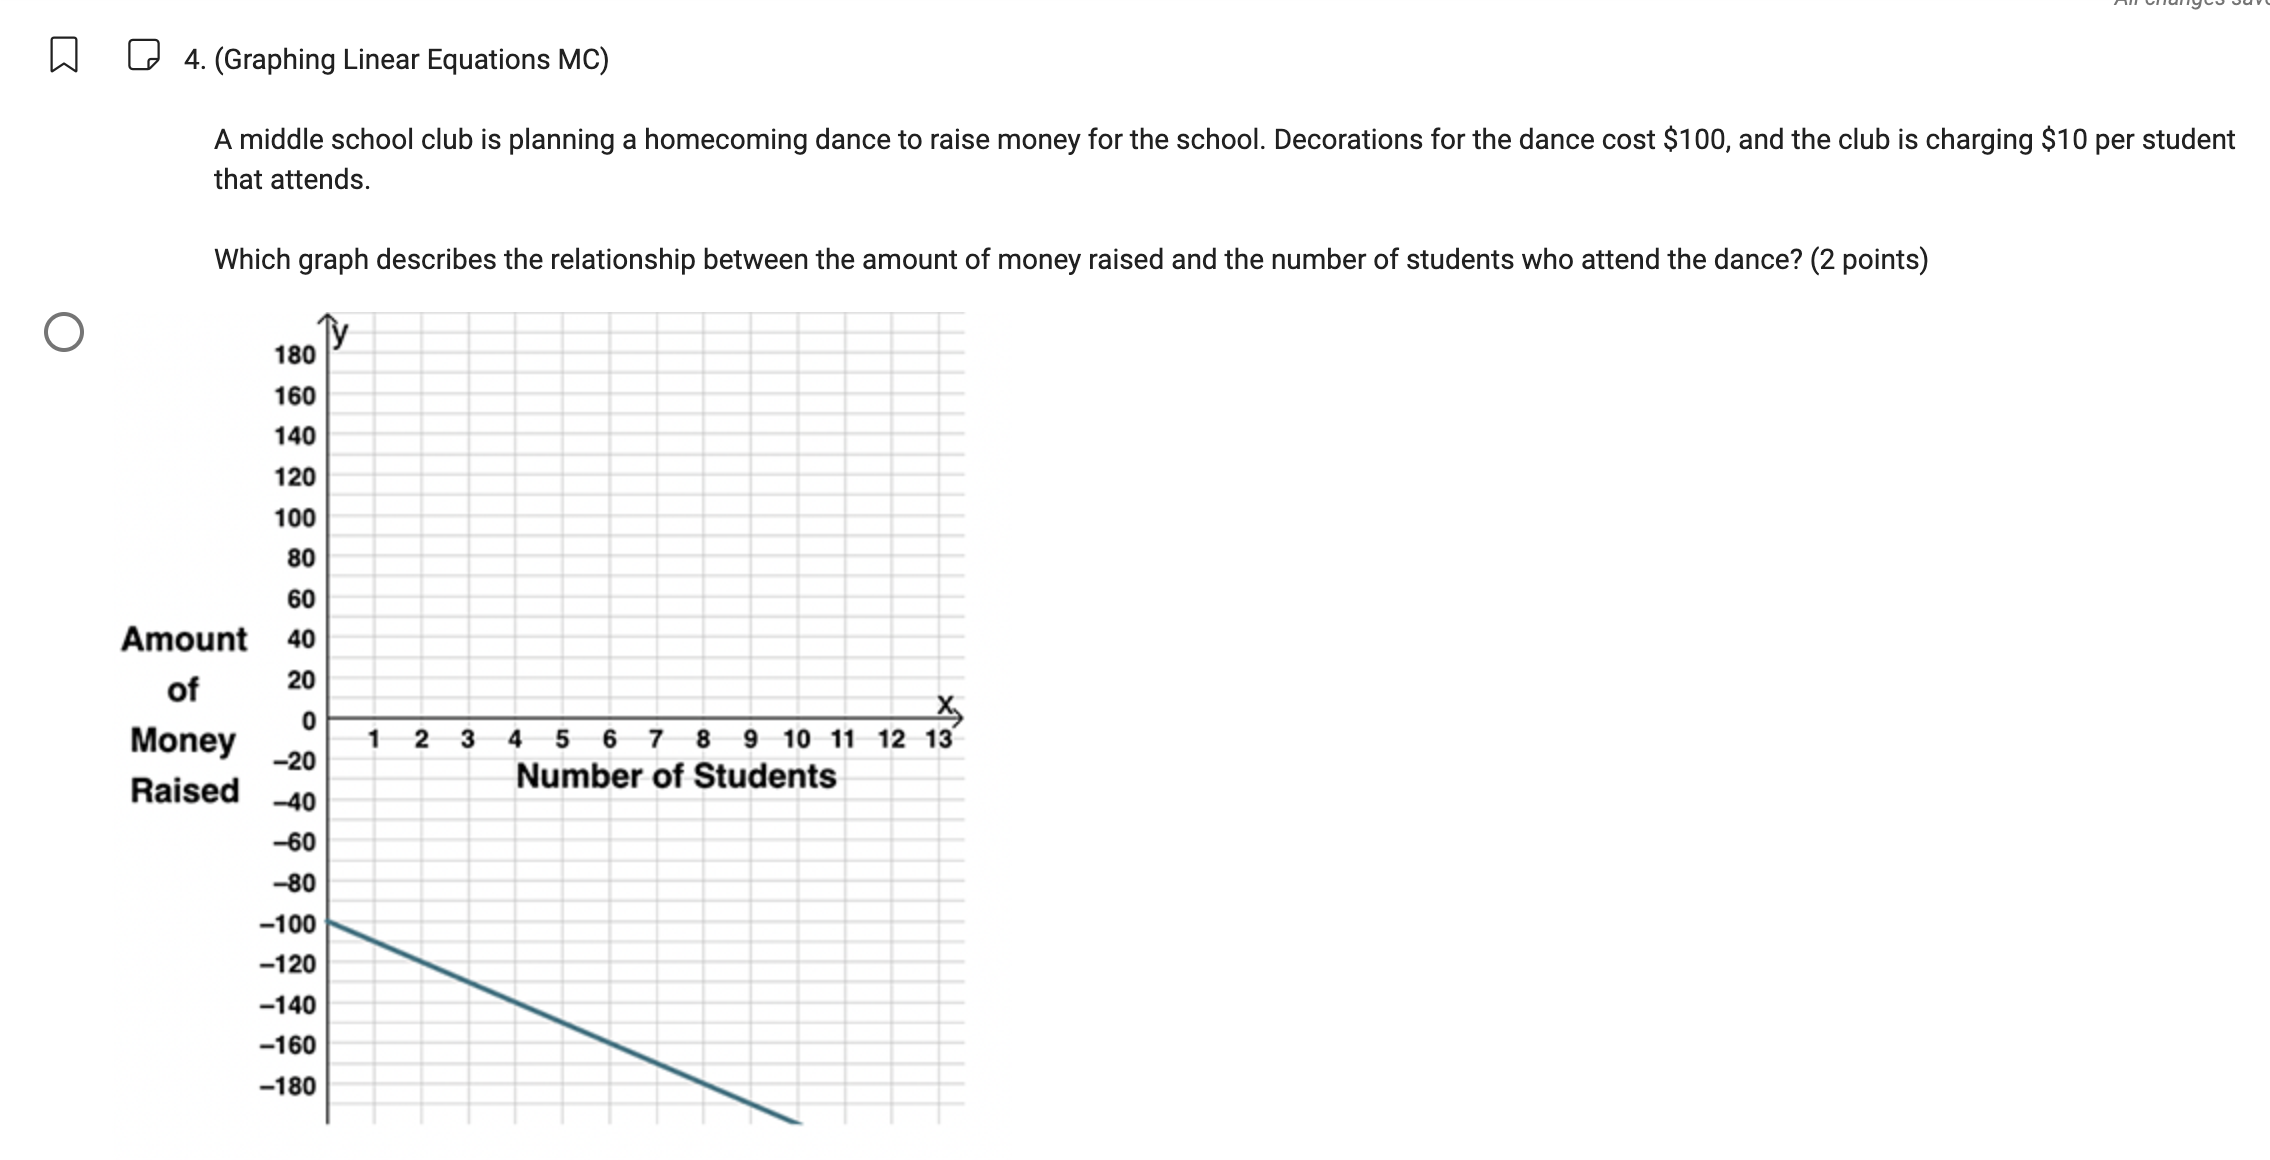
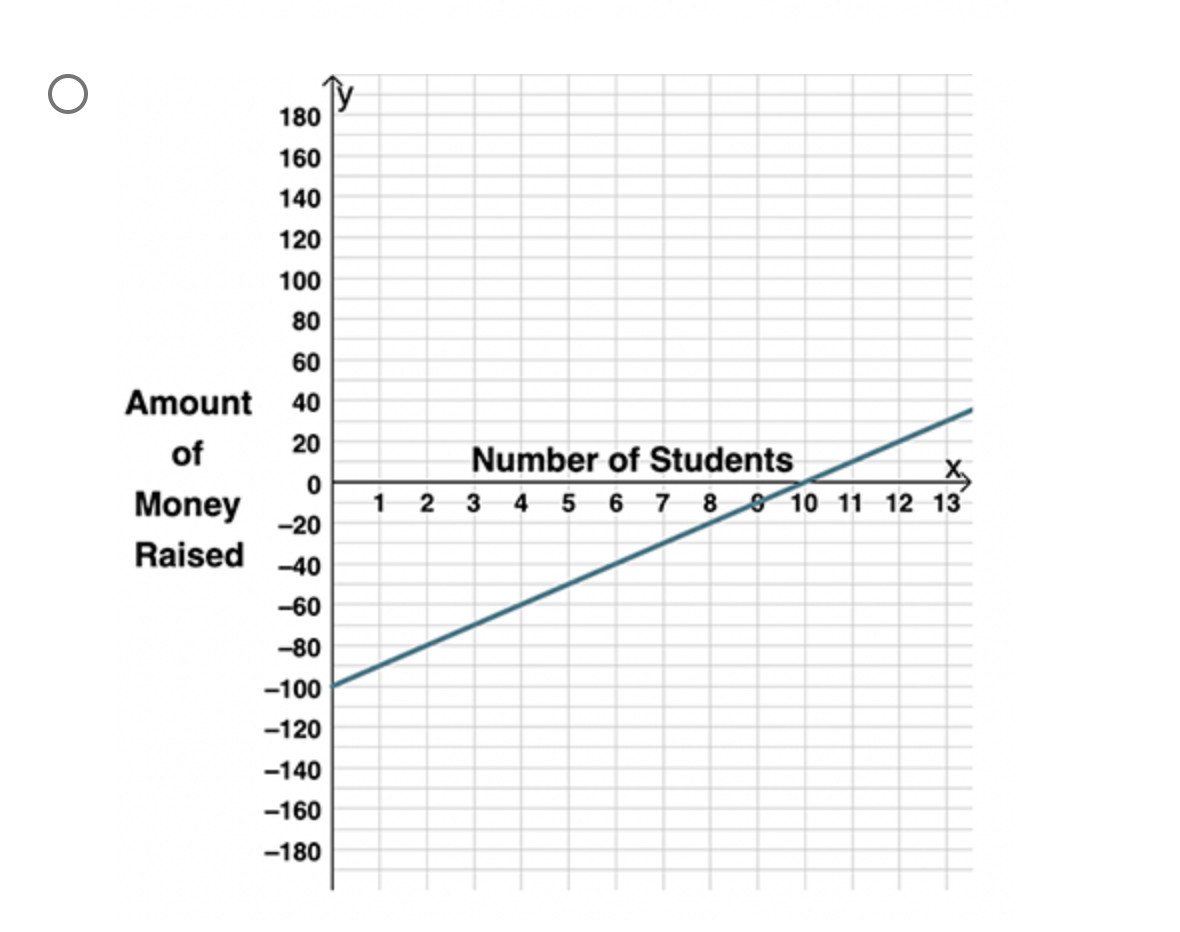
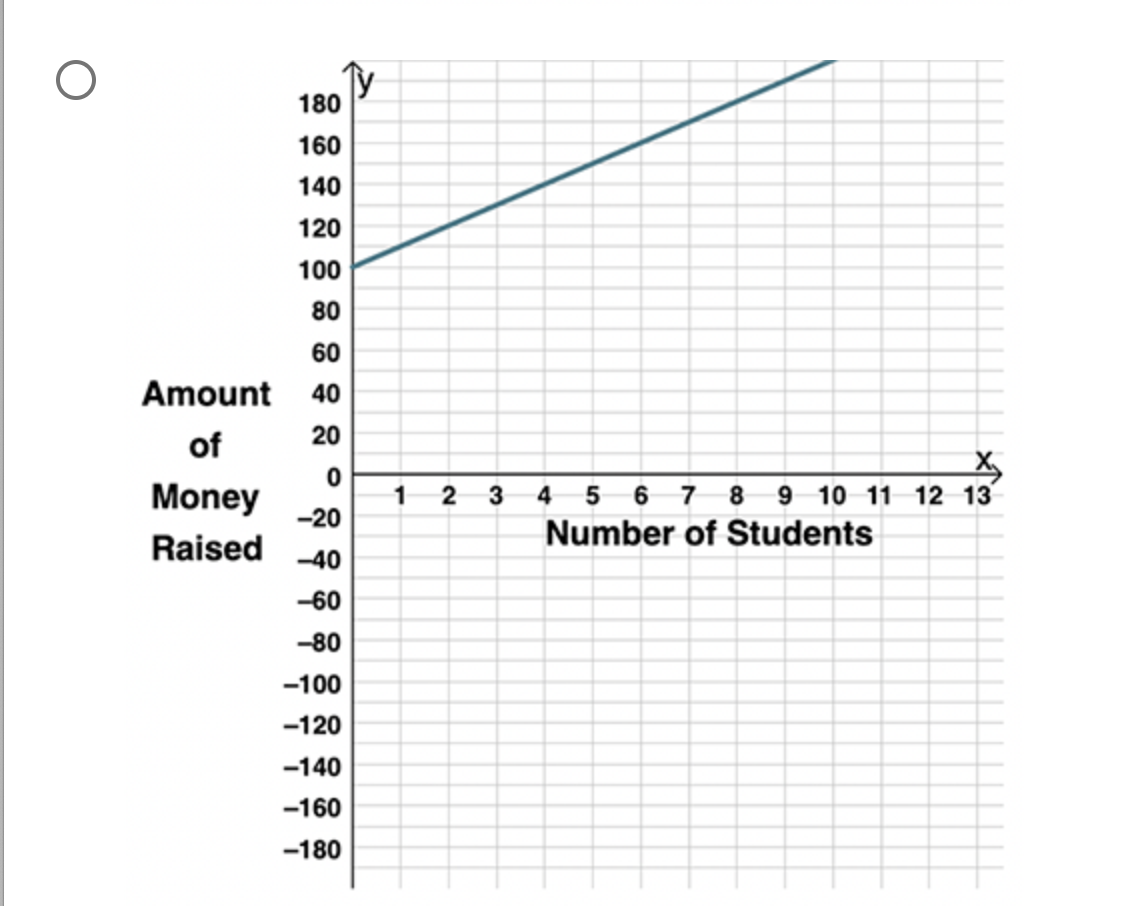
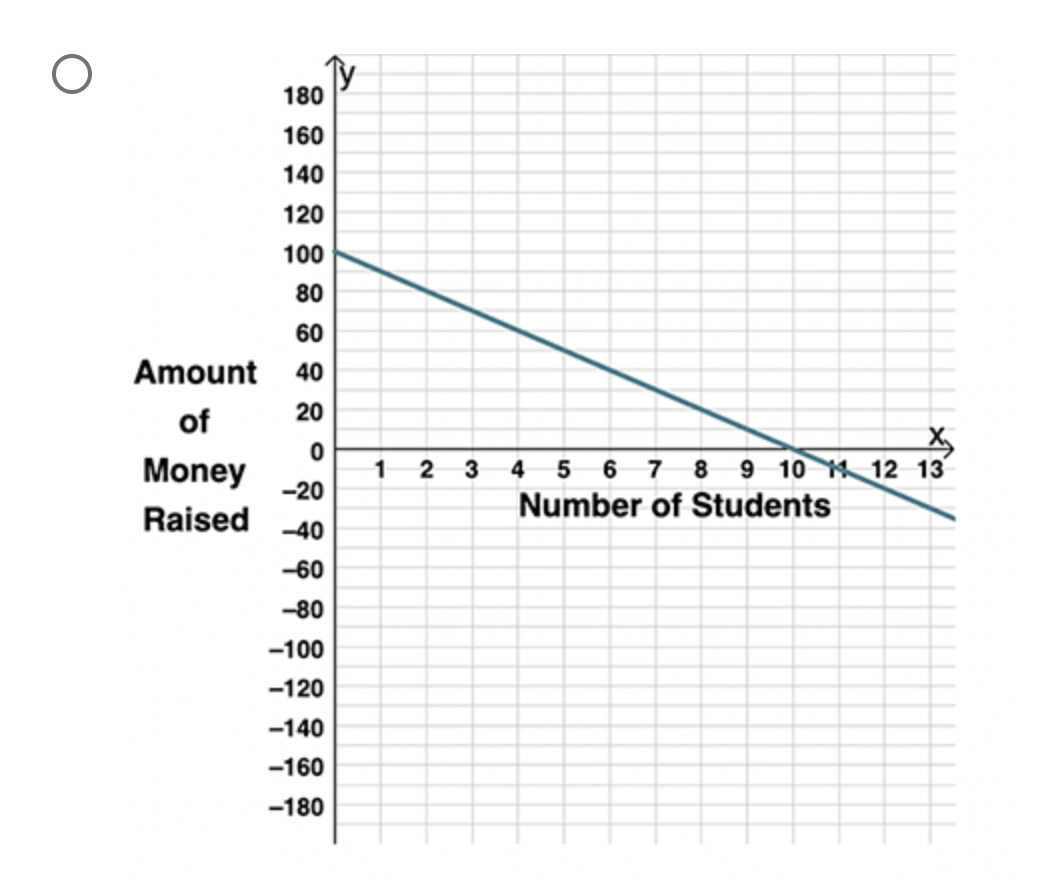
m D 1. (Graphing Linear Equations LC) Which of the following graphs has a slope of -3 and a yintercept of 2? (2 points) 2 O 4442-1012345 O 5 4 3 X 5 -5 -4 -3 -2 -1 0 1 2 3 4 -1 -2 -3 O 2 1 X -5 4 -3 -2 -1 2 3 -1 -2 -3\fW Q 2. (Graphing Linear Equations LC) The table represents a linear relationship. X -1 0 1 2 y 2 0 -2 -4 Which of the following graphs shows this relationship? (2 points) O 5 4 3 2 X -5 -4 3 -2 -1 0 1 2 3 4 5 -2O 5 4 3 2 X 5 -4 -3 -2 -1 9 1 2 3 4 5 1 -2 -5 O Ty 5 4 3 2 X -5 -4 -3 -2 -1 0 1 2 3 4 5 -1 -2\fW Q 3. (Graphing Linear Equations MC) Which graph represents the equation y = - x+2? (2 points) O 5 3 5 4 -3 -2 -1 0 1 2 3 4 5 -1 -2 -3 4 -5\f\fnu \"mug.\" w. t D D 4. (Graphing Linear Equations MC) A middle school club is planning a homecoming dance to raise money for the school. Decorations for the dance cost $100, and the club is charging $10 per student that attends. Which graph describes the relationship between the amount of money raised and the number of students who attend the dance? (2 points) 0 180 160 140 120 80 so Amount 40 0f 20 o Money 20 12 a 4 s 67 e 910111213 Raised :40 Number of Students -so 410 180 160 140 120 100 80 60 Amount 40 of 20 Number of Students X 0 Money 1 2 3 4 5 6 7 8 8 10 11 12 13 20 Raised -40 -60 -80 -100 -120 -140 -160 -180\f\f
Step by Step Solution
There are 3 Steps involved in it
Step: 1
Get Instant Access to Expert-Tailored Solutions
See step-by-step solutions with expert insights and AI powered tools for academic success
Step: 2
Step: 3
Ace Your Homework with AI
Get the answers you need in no time with our AI-driven, step-by-step assistance
Get Started