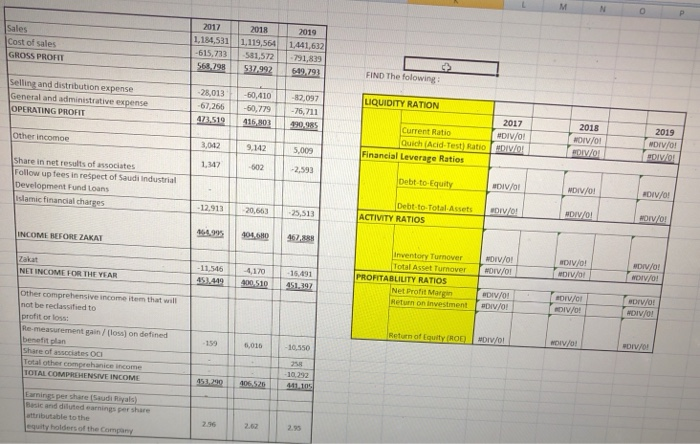
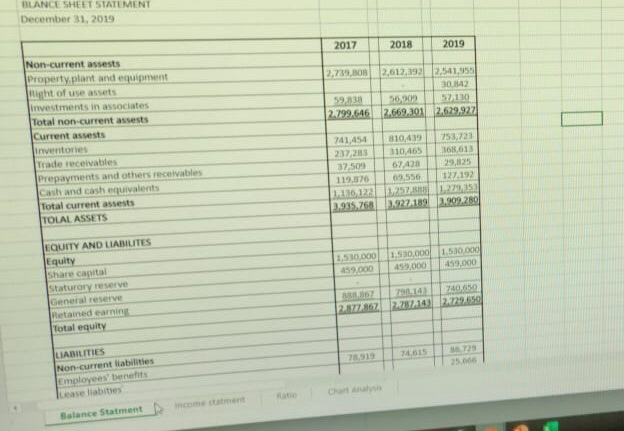
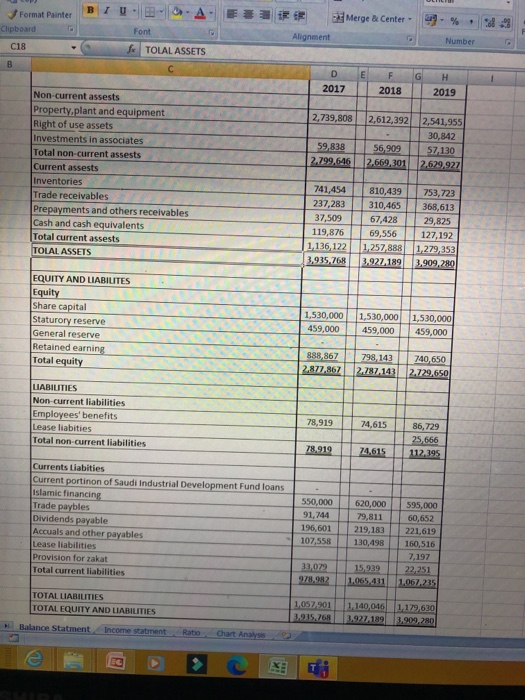
M Sales Cost of sales GROSS PROFIT 2017 1,184,531 -615,723 568.298 2018 1,119,564 581,572 57.992 2019 1.441,632 - 791,839 FIND The folowing: Selling and distribution expense General and administrative expense OPERATING PROFIT -28,013 -67,266 473.519 LIQUIDITY RATION -60,410 -60,779 415, 303 -32,097 -76,711 490.285 2017 #DIV/0! Other income 3,012 Current Ratio Quich (Acid-Test) Ratio Financial Leverage Ratios 2018 NDIV/01 DIV/! 9.142 2019 MDIV/0! IVO: 5,009 1,347 602 -2,593 Share in net results of associates Follow up fees in respect of Saudi Industrial Development Fund Loans islamic financial charges Debt-to Equity DIV/0! MDIV/0! DIV/0! - 12.913 20,663 -25,513 Debt-to-Total Assets ACTIVITY RATIOS HIV/O! DIV/ HIV/0! INCOME BEFORE ZAKAT 11.9 406.60 462,888 Zakat NET INCOME FOR THE YEAR -11,546 MDIV/0! ADIV/0! 4,170 400 510 Inventory Turnover Total Asset Tumover PROFITABLILITY RATIOS Net Profit Margir Return on investment DIV/0! DIV/OP -16.491 451.397 #DIV/0! DIV/0! #DIV/0! #DIV/0! DIV/! DIV/0! DIV/0! DIV/0! other comprehensive income item that will not be reclassified to profit or los Re-measurement gain/loss) on defined benefitplan Share of ascites oci Total other comprehanice income TOTAL COMPREHENSIVE INCOME Return of Equity (ROE 159 DIV/0! 1,016 DIV/01 -10.550 DIV/0! 106.5728 - 10.1992 4.11.103 Earnings per share Saudi Riyals) Basic and diluted earnings per share attributable to the equity holders of the Company 2.96 2.95 BLANCE SHEET STATEMENT December 31, 2019 2017 2018 2019 2.739.B 2,612,193 2,541,955 30.142 56009 57110 2.799.646 2.669,301 2.629.927 Non-current assets Property.plant and equipment night of use assets investments in associates Total non-current assests Current assets inventories Trade receivables Prepayments and others receivables Cash and cash equivalents Total current assets TOLAL ASSETS 741,450 237,23 32.500 119.875 1136122 2.935 26 310.40 310.465 168,613 67,428 29,135 03556 127.192 1:52 3.927A1891.909.280 1.530.000 1.530.000 1.500.000 159.000 159.000 EQUITY AND LIABILITES Equity Share capital staturary reserve General reserve Retained earnin Total equity 700 2.287-141229.650 2.77362 1615 LIABILITIES Non-current liabilities Employees' bench Lease liabities Balance Statment BIU- Format Painter Clipboard Merge & Center % .. Font Alignment Number C18 A TOLAL ASSETS B E F D 2017 2018 H 2019 2,739,808 2,612,392 59,838 2.799.646 56,909 2.669,301 2,541,955 30,842 57,130 2.629,927 Non-current assests Property.plant and equipment Right of use assets Investments in associates Total non-current assests Current assests Inventories Trade receivables Prepayments and others receivables Cash and cash equivalents Total current assests TOLAL ASSETS 741,454 237,283 37,509 119,876 1.136,122 3,935,768 810,439 310,465 67,428 69,556 1,257,888 3.927,189 753,723 368,613 29,825 127,192 1,279,353 3,909,280 EQUITY AND LIABILITES Equity Share capital Staturory reserve General reserve Retained earning Total equity 1,530,000 459,000 1,530,000 459,000 1,530,000 459,000 888,867 2.877.867 798.143 2.787.143 740 650 2.729,650 LIABILITIES Non-current liabilities Employees' benefits Lease liabities Total non-current liabilities 78,919 74,615 86,729 25,666 112.395 78,919 74,615 Currents Liabities Current portion of Saudi Industrial Development Fund loans Islamic financing Trade paybles Dividends payable Accuals and other payables Lease liabilities Provision for zakat Total current liabilities 550,000 91,744 196,601 107,558 620,000 79,811 219,183 130,498 595,000 60,652 221,619 160,516 7,197 22,251 1.067.235 33,079 15,939 1.065.431 TOTAL LIABILITIES TOTAL EQUITY AND LIABILITIES 1,057 201 1.140,046 1.179,630 3.927.189 3,909,280 Balance Statment Income statment Chart Analyse