

Answered step by step
Verified Expert Solution
Question
1 Approved Answer
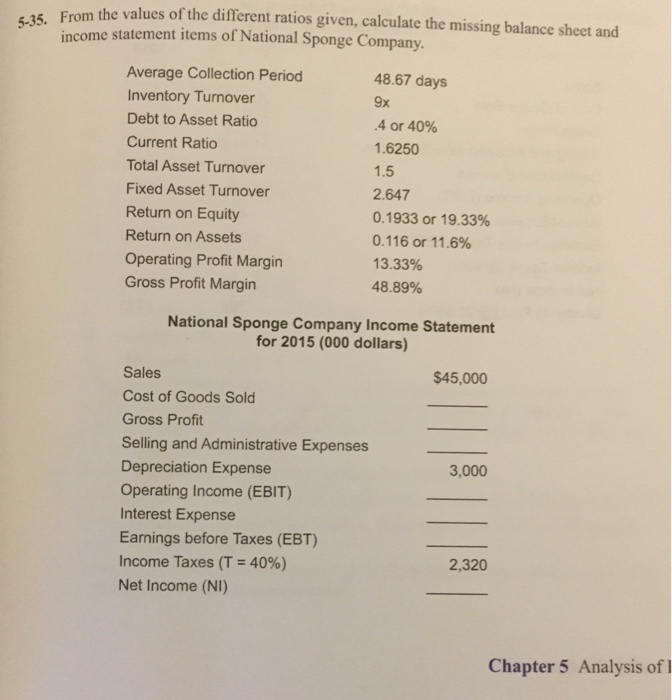
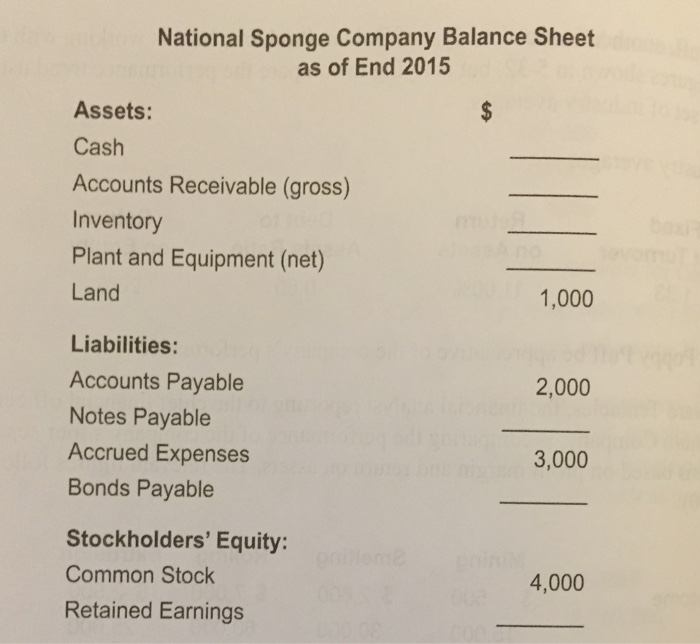
m the values of the different ratios given, calculate the missing balance sheet and income statement items of National Sponge Company. 5-35. From the va
Step by Step Solution
There are 3 Steps involved in it
Step: 1

Get Instant Access to Expert-Tailored Solutions
See step-by-step solutions with expert insights and AI powered tools for academic success
Step: 2

Step: 3
Ace Your Homework with AI
Get the answers you need in no time with our AI-driven, step-by-step assistance
Get Started
Information Audit For The Management Process Empresa Nacional De Productos Agropecuarios ENPA Of Villa Clara
Authors: Alejandra María Osorio Capote, Manuel Osvaldo Machado Rivero, Dianelys Martínez Paz
1st Edition
6203767883, 978-6203767889