Make a code in R ( the basic R)

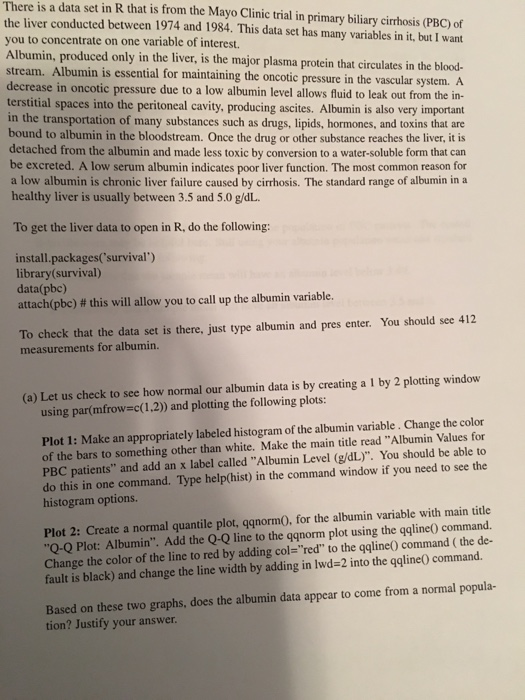
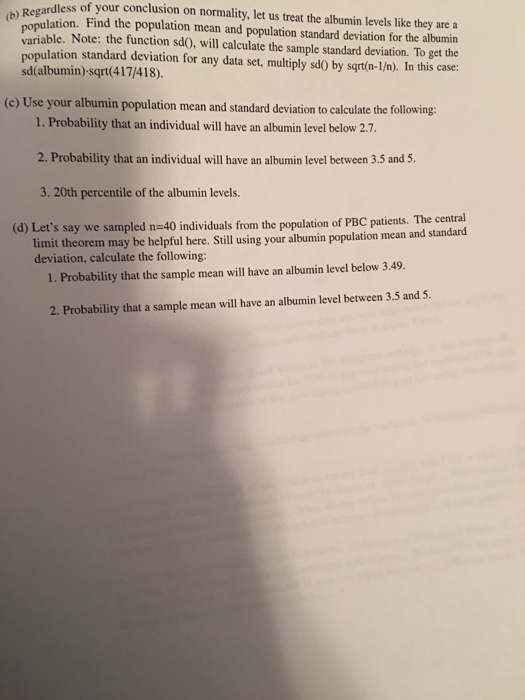
There is a data set in R that is from the Mayo Clinic trial in primary biliary cirhosis (PBC) of the liver conducted between 1974 and 1984. This data set has many variables in it, but I want you to concentrate on one variable of interest. Albumin, produced only in the liver, is the major plasma protein that circulates in the blood- stream. Albumin is essential for maintaining the oncotic pressure in the vascular system. A decrease in oncotic press terstitial spaces into the peritoneal cavity, producing ascites. Albumin is also very important in the transportation of many substances such as drugs, lipids, hormones, and toxins that are bound to albumin in the bloodstream. Once the drug or other substance reaches the liver, it is detached from the albumin and made less toxic by conversion to a water-soluble form that can be excreted. A low serum albumin indicates poor liver function. The most common reason for a low albumin is chronic liver failure caused by cirrhosis. The standard range of albumin in a healthy liver is usually between 3.5 and 5.0 g/dL ure due to a low albumin level allows fluid to leak out from the in- To get the liver data to open in R, do the following: install.packages('survival') library(survival) data(pbc) attach(pbc) # this will allow you to call up the albumin variable. To check that the data set is there, just type albumin and pres enter. You should see 412 measurements for albumin. (a) Let us check to see how normal our albumin data is by creating a 1 by 2 plotting window using par(mfrow=c(1,2)) and plotting the following plots: Plot 1: Make an appropriately labeled histogram of the albumin variable. Change the color of the bars to something other than white. Make the main title read "Albumin Values for PBC patients" and add an x label called "Albumin Level (g/dL)". You should be able to do this in one command. Type help(hist) in the command window if you need to see the histogram options Plot 2: Create a normal quantile plot, qqnorm0, for the albumin variable with main title "Q-Q Plot: Albumin". Add the Q-Q line to the qqnorm plot using the qqline0 command. Change the color of the line to red by adding col- "red" to the qqline0 command (the de- fault is black) and change the line width by adding in lwd-2 into the qqline0 command. Based on these two graphs, does the albumin data appear to come from a normal popula- tion? Justify your answer pesardless of your conclusion on normality, let us treat the albumin levels like they are a ation. Find the population mean and population standard deviation for the albumin variable. Note: the function sd0, will calculate the sample standard deviation. To get the tandard deviation for any data set, multiply sd0 by sqrt(n-1). In this case: population s sd(albumin)-sqrt(417/418). (e) Use your albumin population mean and standard deviation to calculate the following: 1. Probability that an individual will have an albumin level below 2.7. 2. Probability that an individual will have an albumin level between 3.5 and 5 3. 20th percentile of the albumin levels. t's say we sampled n-40 individuals from the population of PBC patients. The central r albumin population mean and standard (d) Le limit theorem may be helpful here. Still using you deviation, calculate the following: 1. Probability that the sample mean will have an albumin level below 3.49. 2. Probability that a sample mean will have an albumin level between 3.5 and 5


