

Answered step by step
Verified Expert Solution
Question
1 Approved Answer
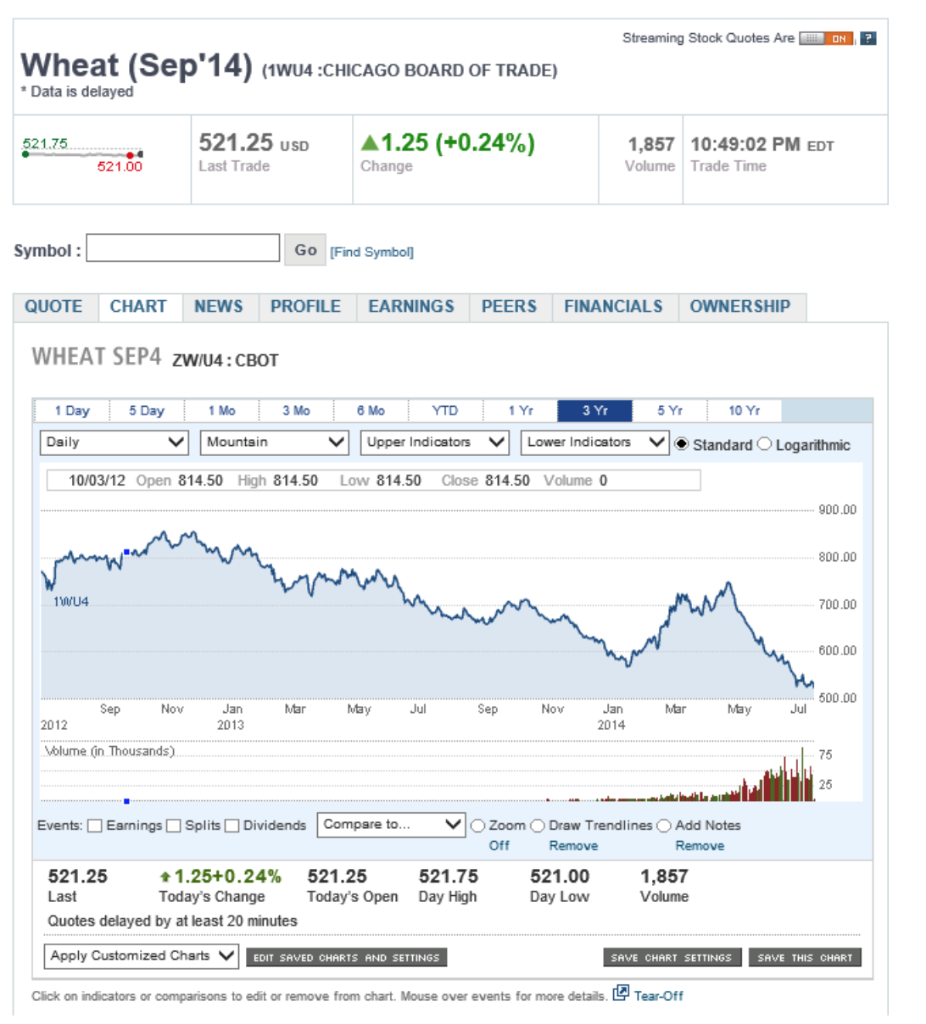
Make a conclusion about what you see in the data below? What do you think might have been the underlying events or trends that caused
- Make a conclusion about what you see in the data below? What do you think might have been the underlying events or trends that caused the behavior you observed?
- What audience do you think they had in mind when the folks at CNBC created this presentation? Make a suggestion that might improve the presentation of the data in the picture?
Please help.
Streaming Stock Quotes Are B ON Wheat (Sep'14) (1W04 :CHICAGO BOARD OF TRADE) * Data is delayed 521.75 521.25 USD 1.25 (+0.24%) 521.00 1,857 10:49:02 PM EDT Volume Trade Time Last Trade Change Symbol: Go [Find Symbol) QUOTE CHART NEWS PROFILE EARNINGS PEERS FINANCIALS OWNERSHIP WHEAT SEP4 Zw/U4:CBOT 1 Day 5 Day 1 Mo 13 Mo 16 Mo YTD 11 Y 3Y5Y10 Y Mountain Upper Indicators Lower Indicators V .Standard Daily Logarithmic 10/03/12 Open 814.50 High 814.50 Low 814.50 Close 814.50 Volume 0 900.00 800.00 1W04 700.00 600.00 Sep Nov Jan 2013 Mar May Jul Sep Nov Jan 2014 Mar May ... 500.00 Jul 2012 Volume (in Thousands) Events: Earnings Splits Dividends Compare to... O Zoom Off 521.25 +1.25+0.24% 521.25 521.75 Last Today's Change Today's Open Day High Quotes delayed by at least 20 minutes Draw Trendlines Add Notes Remove Remove 521.00 1,857 Day Low Volume Apply Customized Charts EDIT SAVED CHARTS AND SETTINGS SAVE CHART SETTINGS SAVE THIS CHART Click on indicators or comparisons to edit or remove from chart. Mouse over events for more details. Tear-OffStep by Step Solution
There are 3 Steps involved in it
Step: 1

Get Instant Access to Expert-Tailored Solutions
See step-by-step solutions with expert insights and AI powered tools for academic success
Step: 2

Step: 3
Ace Your Homework with AI
Get the answers you need in no time with our AI-driven, step-by-step assistance
Get Started
Capitalism Without Capital The Rise Of The Intangible Economy
Authors: Jonathan Haskel, Stian Westlake
1st Edition
0691183295, 978-0691183299