

Question
- Make a graph of the above-mentioned data and compare the data to regression fits of the following virial expression for the osmotic pressure, i.e.,
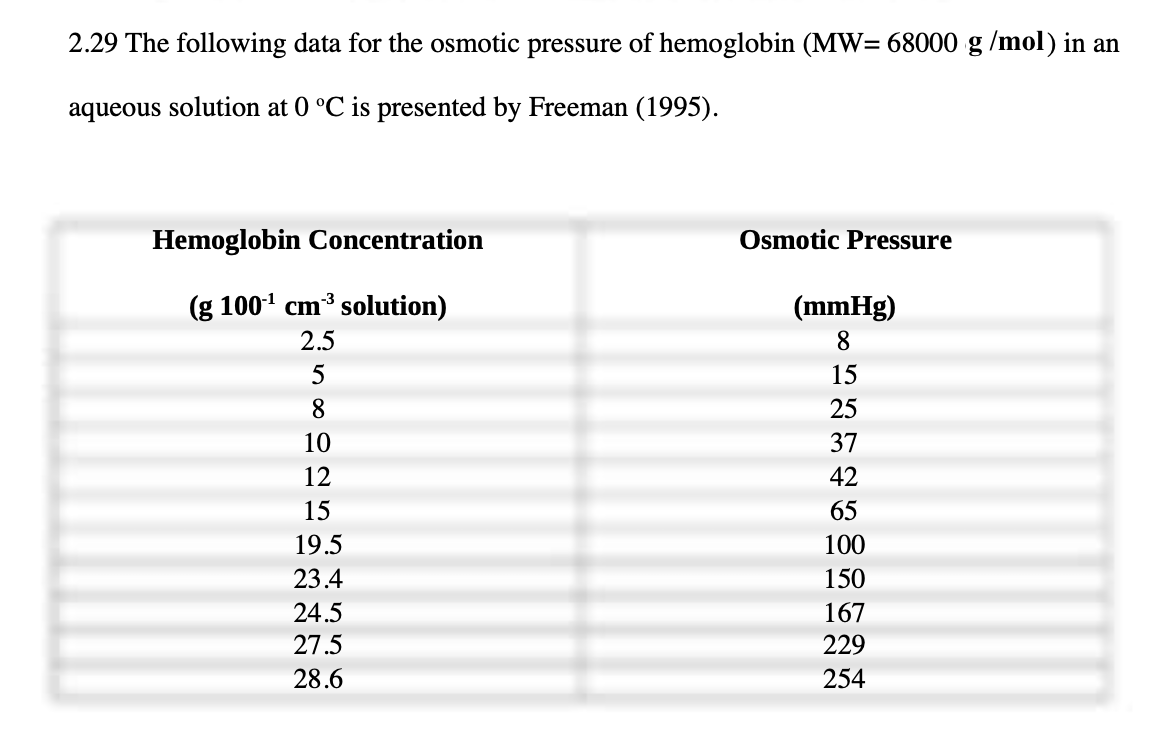
- Make a graph of the above-mentioned data and compare the data to regression fits of the following virial expression for the osmotic pressure, i.e., = (RTc2/MW2)[1+Bc2+Cc22].
- Show that when B and C are equal to zero, the resulting expression, i.e., vant Hoffs law, fits the data quite well at low hemoglobin concentrations where the solution is expected to be ideal.
- Next, explore how the fit to these data improves by performing a nonlinear regression to find the value of B, with C = 0.
- Then, perform another nonlinear regression that includes B and C.
2.29 The following data for the osmotic pressure of hemoglobin (MW=68000g/mol) in an aqueous solution at 0C is presented by Freeman (1995)Step by Step Solution
There are 3 Steps involved in it
Step: 1

Get Instant Access to Expert-Tailored Solutions
See step-by-step solutions with expert insights and AI powered tools for academic success
Step: 2

Step: 3
Ace Your Homework with AI
Get the answers you need in no time with our AI-driven, step-by-step assistance
Get Started
Introduction To Software For Chemical Engineers
Authors: Mariano Martín Martín
2nd Edition
1138324213, 978-1138324213