

Question
Make a table of the proportion, p, of household income spent on beef per week as a function of price and income. (Note that p
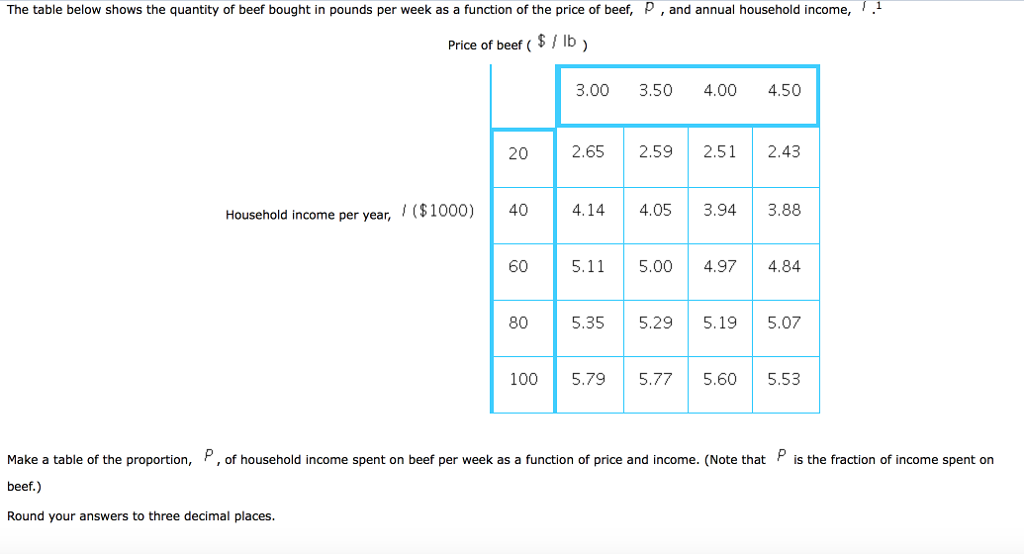
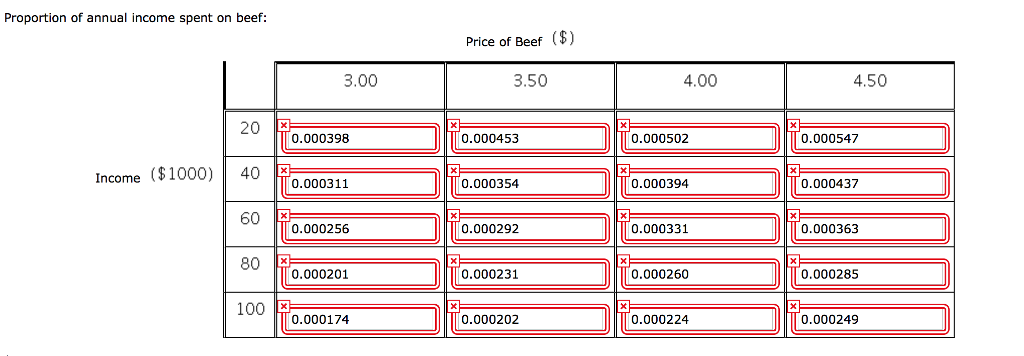 Make a table of the proportion, p, of household income spent on beef per week as a function of price and income. (Note that p is the fraction of income spent on beef.) None of the answers i'm getting is within 3 decimals that isnt 0.
Step by Step Solution
There are 3 Steps involved in it
Step: 1

Get Instant Access to Expert-Tailored Solutions
See step-by-step solutions with expert insights and AI powered tools for academic success
Step: 2

Step: 3
Ace Your Homework with AI
Get the answers you need in no time with our AI-driven, step-by-step assistance
Get Started
Portfolio Of Business And Management Audits
Authors: Baumhardt And Partner
1st Edition
3908131006, 978-3908131007