

Answered step by step
Verified Expert Solution
Question
1 Approved Answer
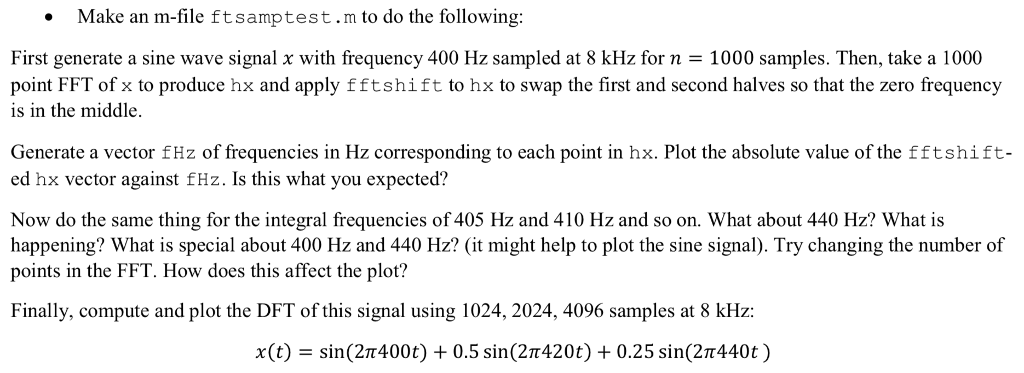
Make an m-file ftsamptest.m to do the following: First generate a sine wave signal x with frequency 400 Hz sampled at 8 kHz for n
Step by Step Solution
There are 3 Steps involved in it
Step: 1

Get Instant Access to Expert-Tailored Solutions
See step-by-step solutions with expert insights and AI powered tools for academic success
Step: 2

Step: 3
Ace Your Homework with AI
Get the answers you need in no time with our AI-driven, step-by-step assistance
Get Started
Practical Neo4j
Authors: Gregory Jordan
1st Edition
1484200225, 9781484200223