

Question
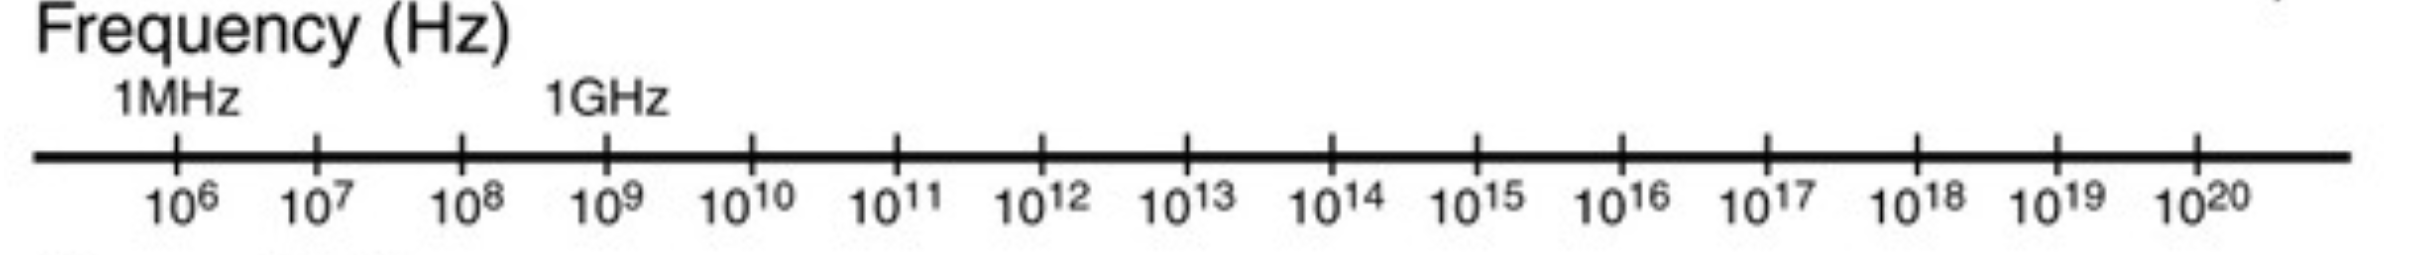
Make plot of the electromagnetic spectrum using Python (provide code). Label Frequency Your end product should look something like this: Frequency (Hz) 1MHz. 106 107
Make plot of the electromagnetic spectrum using Python (provide code).
Label Frequency
Your end product should look something like this:
Step by Step Solution
There are 3 Steps involved in it
Step: 1

Get Instant Access to Expert-Tailored Solutions
See step-by-step solutions with expert insights and AI powered tools for academic success
Step: 2

Step: 3
Ace Your Homework with AI
Get the answers you need in no time with our AI-driven, step-by-step assistance
Get Started
Machine Learning And Knowledge Discovery In Databases European Conference Ecml Pkdd 2015 Porto Portugal September 7 11 2015 Proceedings Part 2 Lnai 9285
Authors: Annalisa Appice ,Pedro Pereira Rodrigues ,Vitor Santos Costa ,Joao Gama ,Alipio Jorge ,Carlos Soares
1st Edition
3319235249, 978-3319235240