Make sure to go through all sections and complete all tasks please
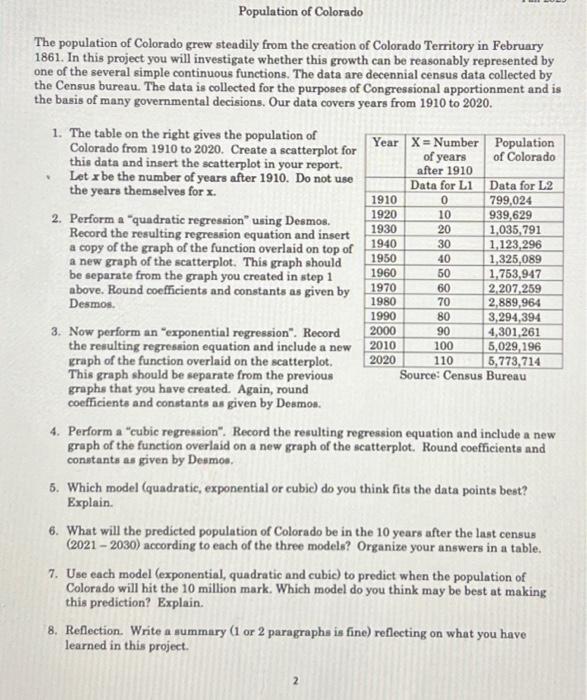
The population of Colorado grew steadily from the creation of Colorado Territory in February 1861. In this project you will investigate whether this growth can be reasonably represented by one of the several simple continuous functions. The data are decennial census data collected by the Census bureau. The data is collected for the purposes of Congressional apportionment and is the basis of many governmental decisions. Our data covers years from 1910 to 2020 . 1. The table on the right gives the population of Colorado from 1910 to 2020 . Create a scatterplot for this data and insert the scatterplot in your report. - Let x be the number of years after 1910. Do not use the years themselves for x. 2. Perform a "quadratic regression" using Desmos. Record the resulting regression equation and insert a copy of the graph of the function overlaid on top of a new graph of the scatterplot. This graph should be separate from the graph you created in step 1 above. Round coefficients and constants as given by Desmos. 3. Now perform an "exponential regression". Record the resulting regression equation and include a new graph of the function overlaid on the scatterplot. This graph should be separate from the previous graphs that you have created. Again, round coefficients and constants as given by Desmos. 4. Perform a "cubic regression". Record the resulting regression equation and include a new graph of the function overlaid on a new graph of the scatterplot. Round coefficients and constants as given by Desmos. 5. Which model (quadratic, exponential or cubie) do you think fits the data points best? Explain. 6. What will the predicted population of Colorado be in the 10 years after the last census (2021 - 2030) according to each of the three models? Organize your answers in a table. 7. Use each model (exponential, quadratic and cubic) to predict when the population of Colorado will hit the 10 million mark. Which model do you think may be best at making this prediction? Explain. 8. Reflection. Write a summary ( 1 or 2 paragraphs is fine) reflecting on what you have learned in this project. 2 The population of Colorado grew steadily from the creation of Colorado Territory in February 1861. In this project you will investigate whether this growth can be reasonably represented by one of the several simple continuous functions. The data are decennial census data collected by the Census bureau. The data is collected for the purposes of Congressional apportionment and is the basis of many governmental decisions. Our data covers years from 1910 to 2020 . 1. The table on the right gives the population of Colorado from 1910 to 2020 . Create a scatterplot for this data and insert the scatterplot in your report. - Let x be the number of years after 1910. Do not use the years themselves for x. 2. Perform a "quadratic regression" using Desmos. Record the resulting regression equation and insert a copy of the graph of the function overlaid on top of a new graph of the scatterplot. This graph should be separate from the graph you created in step 1 above. Round coefficients and constants as given by Desmos. 3. Now perform an "exponential regression". Record the resulting regression equation and include a new graph of the function overlaid on the scatterplot. This graph should be separate from the previous graphs that you have created. Again, round coefficients and constants as given by Desmos. 4. Perform a "cubic regression". Record the resulting regression equation and include a new graph of the function overlaid on a new graph of the scatterplot. Round coefficients and constants as given by Desmos. 5. Which model (quadratic, exponential or cubie) do you think fits the data points best? Explain. 6. What will the predicted population of Colorado be in the 10 years after the last census (2021 - 2030) according to each of the three models? Organize your answers in a table. 7. Use each model (exponential, quadratic and cubic) to predict when the population of Colorado will hit the 10 million mark. Which model do you think may be best at making this prediction? Explain. 8. Reflection. Write a summary ( 1 or 2 paragraphs is fine) reflecting on what you have learned in this project. 2