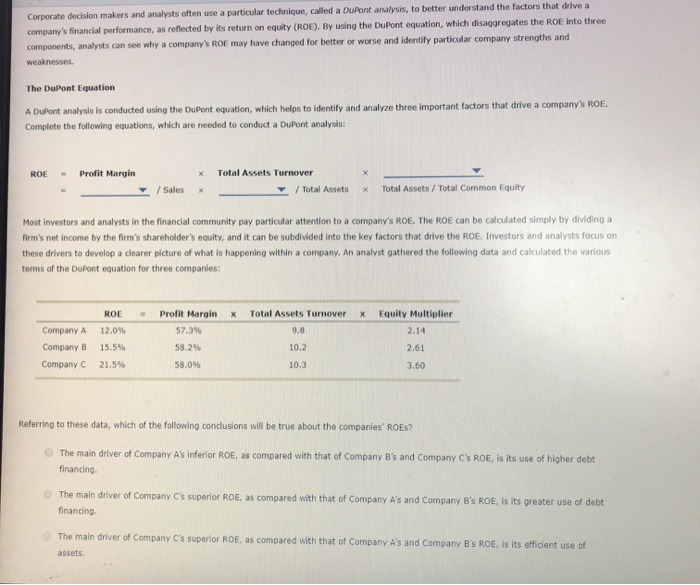
makers and analysts often use a particular technique, called a DuPont analysis, to better understand the factors that drive a company's financial performance, as reflected by its return on equity (ROE). By using the DuPont equation, which disaggregates the ROE into three components, analysts can see why a company's ROE may have changed for better or worse and identify particular company strengths and weaknesses. The DuPont Equation A DuPont analysis is conducted using the DuPont equation, which helps to identify and analyze three important factors that drive a company's ROE. Complete the following equations, which are needed to conduct a DuPont analysis: x Total Assets Turnover ROE Profit Margin / Total Assets Total Assets / Total Common Equity /Sales Most investors and analysts in the financial community pay particular attention to a company's ROE. The ROE can be calculated simply by dividing a firm's net income by the firm's shareholder's equity, and it can be subdivided into the key factors that drive the ROE. Investors and analysts focus on these drivers to develop a clearer picture of what is happening within a company. An analyst gathered the following data and calculated the various terms of the DuPont equation for three companies: ROE Profit Margin x Total Assets Turnover x Equity Multiplier Company A 12.0% 57.3% 9.8 2.14 10.2 58.2% Company B 15.5% 2.61 Company C 21.5% 58.0% 10.3 3,60 Referring to these data, which of the following conclusions will be true about the companies ROEs? O The main driver of Company A's inferior ROE, as compared with that of Company B's and Company C's ROE, is its use of higher debt financing. The main driver of Company C's superior ROE, as compared with that of Company A's and Company B's ROE, is its greater use of debt finanding. The main driver of Company C's superior ROE, as compared with that of c mpany A's and Company B's ROE, is its efficient use of assets