

Question
MANAGERIAL Accounting Johnson & Johnson s 2009 financial statements include the following items (all dollars in millions): EXERCISE 14.15 Ratio Analysis for Feature Company E
MANAGERIAL Accounting
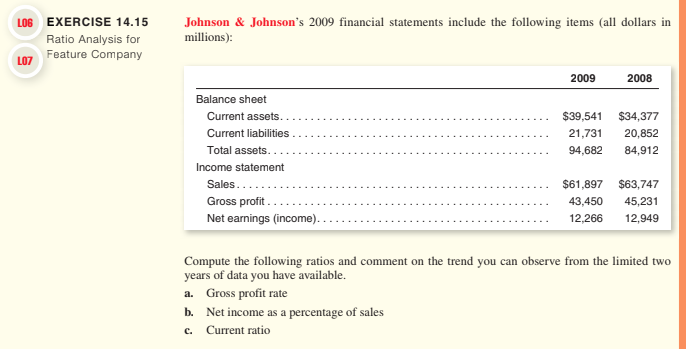
Johnson & Johnson s 2009 financial statements include the following items (all dollars in millions):
EXERCISE 14.15 Ratio Analysis for Feature Company E R LO6 F LO7 2009 2008 Balance sheet Current assets. . . . . . . . . . . . . . . . . . . . . . . . . . . . . . . . . . . . . . . . . . . . $39,541 $34,377 Current liabilities. . . . . . . . . . . . . . . . . . . . . . . . . . . . . . . . . . . . . . . . . . 21,731 20,852 Total assets. . . . . . . . . . . . . . . . . . . . . . . . . . . . . . . . . . . . . . . . . . . . . . 94,682 84,912 Income statement Sales . . . . . . . . . . . . . . . . . . . . . . . . . . . . . . . . . . . . . . . . . . . . . . . . . . . $61,897 $63,747 Gross profit. . . . . . . . . . . . . . . . . . . . . . . . . . . . . . . . . . . . . . . . . . . . . . 43,450 45,231 Net earnings (income). . . . . . . . . . . . . . . . . . . . . . . . . . . . . . . . . . . . . . 12,266 12,949 Campers, Industry Inc. Average Sales (net) . . . . . . . . . . . . . . . . . . . . . . . . . . . . . . . . . . . . . . . . . . $20,000,000 100% Cost of goods sold . . . . . . . . . . . . . . . . . . . . . . . . . . . . . . . . . . . . 9,800,000 57 Gross profit on sales . . . . . . . . . . . . . . . . . . . . . . . . . . . . . . . . . . $10,200,000 43% Operating expenses: Selling . . . . . . . . . . . . . . . . . . . . . . . . . . . . . . . . . . . . . . . . . . . . $ 4,200,000 16% General and administrative . . . . . . . . . . . . . . . . . . . . . . . . . . . . 3,400,000 20 Total operating expenses . . . . . . . . . . . . . . . . . . . . . . . . . . . . . . . $ 7,600,000 36% Operating income . . . . . . . . . . . . . . . . . . . . . . . . . . . . . . . . . . . . . $ 2,600,000 7% Income tax expense. . . . . . . . . . . . . . . . . . . . . . . . . . . . . . . . . . . 1,200,000 3 Net income. . . . . . . . . . . . . . . . . . . . . . . . . . . . . . . . . . . . . . . . . . $ 1,400,000 4% Return on assets. . . . . . . . . . . . . . . . . . . . . . . . . . . . . . . . . . . . . . 23% 14% Compute the following ratios and comment on the trend you can observe from the limited two years of data you have available.
FIND
a. Gross profit rate
b. Net income as a percentage of sales
c. Current ratio
QUESTION PICTURED BELOW
Step by Step Solution
There are 3 Steps involved in it
Step: 1

Get Instant Access to Expert-Tailored Solutions
See step-by-step solutions with expert insights and AI powered tools for academic success
Step: 2

Step: 3
Ace Your Homework with AI
Get the answers you need in no time with our AI-driven, step-by-step assistance
Get Started
Fundamental financial accounting concepts
Authors: Thomas P. Edmonds, Frances M. Mcnair, Philip R. Olds, Edward
8th edition
978-007802536, 9780077648831, 0078025362, 77648838, 978-0078025365