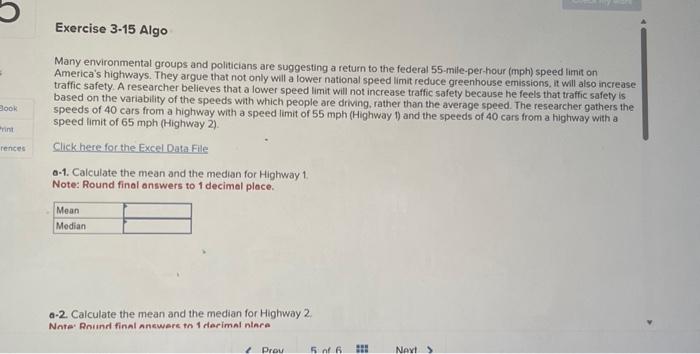
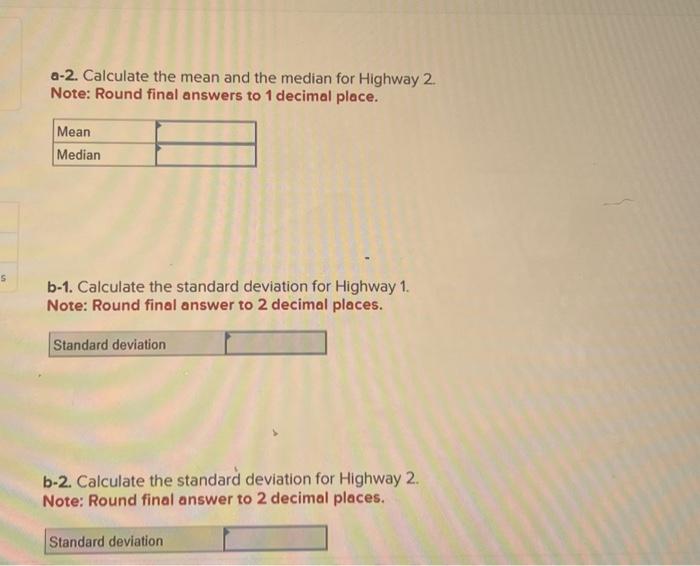
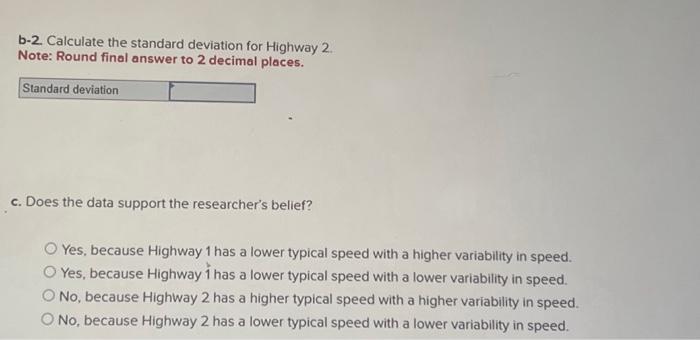
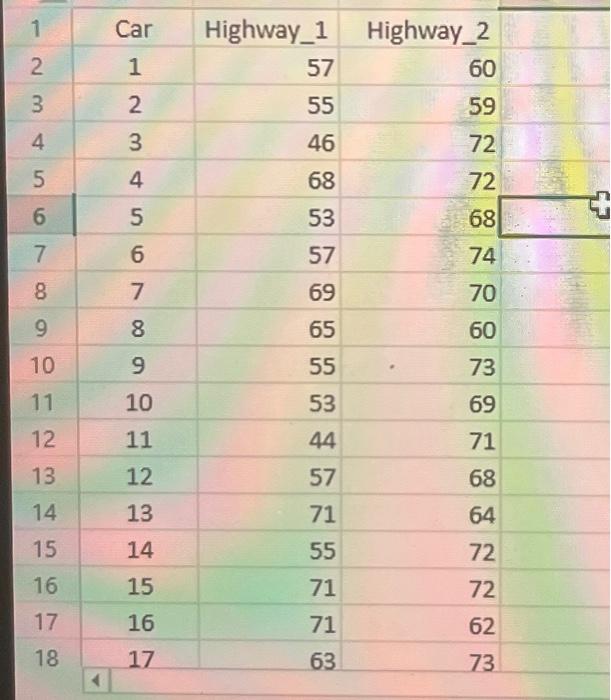
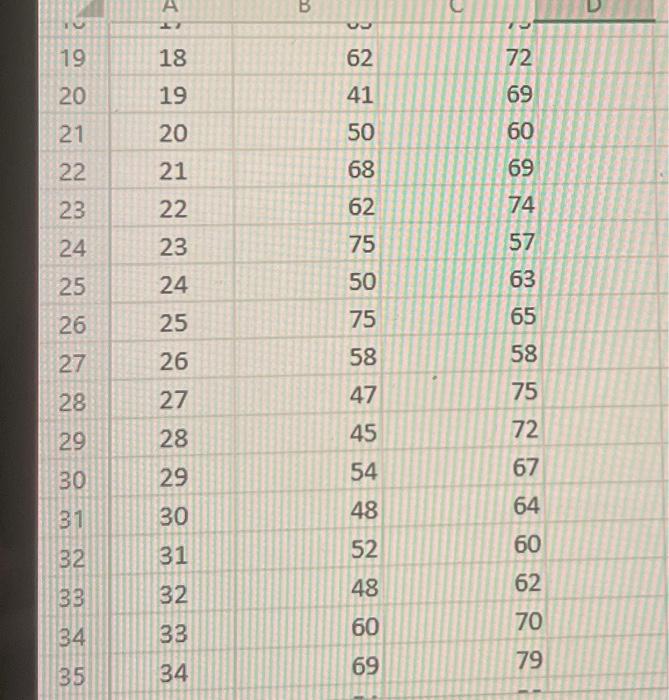
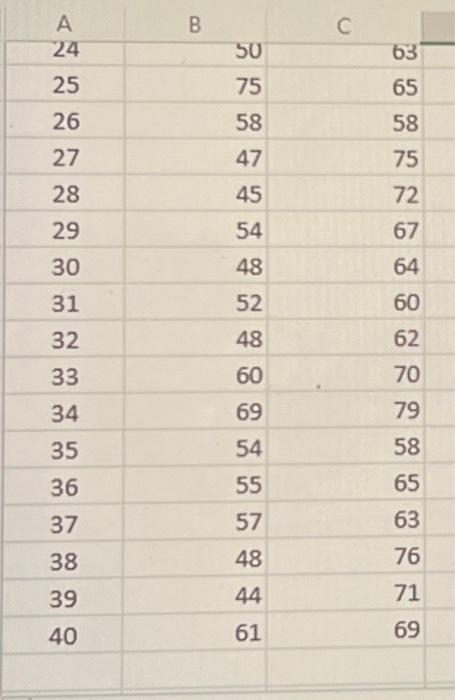
Many environmental groups and politicians are suggesting a return to the federal 55 -mile-per-hour (mph) speed limit on America's highways. They argue that not only will a lower national speed limit reduce greenhouse emissions, it will also increase traffic safety. A researcher believes that a lower speed limit will not increase traffic safety because he feels that traffic safety is based on the variability of the speeds with which people are driving, rather than the average speed. The researcher gathers the speeds of 40 cars from a highway with a speed limit of 55mph (Highway 1 ) and the speeds of 40 cars from a highway with a speed limit of 65mph (Highway 2). Click here for the Excel Data Flle o-1. Calculate the mean and the median for Highway 1 Note: Round final answers to 1 decimal place. a-2. Calculate the mean and the median for Highway 2 Note: Rniund final anewere in 1 derimal nlara a-2. Calculate the mean and the median for Highway 2. Note: Round final answers to 1 decimal place. b-1. Calculate the standard deviation for Highway 1. Note: Round final answer to 2 decimal places. b-2. Calculate the standard deviation for Highway 2. Note: Round final answer to 2 decimal places. b-2. Calculate the standard deviation for Highway 2 Note: Round final answer to 2 decimal places. c. Does the data support the researcher's belief? Yes, because Highway 1 has a lower typical speed with a higher variability in speed. Yes, because Highway 1 has a lower typical speed with a lower variability in speed. No, because Highway 2 has a higher typical speed with a higher variability in speed. No, because Highway 2 has a lower typical speed with a lower variability in speed. \begin{tabular}{|c|c|r|r|} \hline 1 & Car & Highway_1 & Highway_2 \\ \hline 2 & 1 & 57 & 60 \\ \hline 3 & 2 & 55 & 59 \\ \hline 4 & 3 & 46 & 72 \\ \hline 5 & 4 & 68 & 72 \\ \hline 6 & 5 & 53 & 68 \\ \hline 7 & 6 & 57 & 74 \\ \hline 8 & 7 & 69 & 70 \\ \hline 9 & 8 & 65 & 60 \\ \hline 10 & 9 & 55 & 73 \\ \hline 11 & 10 & 53 & 69 \\ \hline 12 & 11 & 44 & 71 \\ \hline 13 & 12 & 57 & 68 \\ \hline 14 & 13 & 71 & 64 \\ \hline 15 & 14 & 55 & 72 \\ \hline 16 & 15 & 71 & 72 \\ \hline 17 & 16 & 71 & 62 \\ \hline 18 & 17 & 63 & 73 \\ \hline \end{tabular} Many environmental groups and politicians are suggesting a return to the federal 55 -mile-per-hour (mph) speed limit on America's highways. They argue that not only will a lower national speed limit reduce greenhouse emissions, it will also increase traffic safety. A researcher believes that a lower speed limit will not increase traffic safety because he feels that traffic safety is based on the variability of the speeds with which people are driving, rather than the average speed. The researcher gathers the speeds of 40 cars from a highway with a speed limit of 55mph (Highway 1 ) and the speeds of 40 cars from a highway with a speed limit of 65mph (Highway 2). Click here for the Excel Data Flle o-1. Calculate the mean and the median for Highway 1 Note: Round final answers to 1 decimal place. a-2. Calculate the mean and the median for Highway 2 Note: Rniund final anewere in 1 derimal nlara a-2. Calculate the mean and the median for Highway 2. Note: Round final answers to 1 decimal place. b-1. Calculate the standard deviation for Highway 1. Note: Round final answer to 2 decimal places. b-2. Calculate the standard deviation for Highway 2. Note: Round final answer to 2 decimal places. b-2. Calculate the standard deviation for Highway 2 Note: Round final answer to 2 decimal places. c. Does the data support the researcher's belief? Yes, because Highway 1 has a lower typical speed with a higher variability in speed. Yes, because Highway 1 has a lower typical speed with a lower variability in speed. No, because Highway 2 has a higher typical speed with a higher variability in speed. No, because Highway 2 has a lower typical speed with a lower variability in speed. \begin{tabular}{|c|c|r|r|} \hline 1 & Car & Highway_1 & Highway_2 \\ \hline 2 & 1 & 57 & 60 \\ \hline 3 & 2 & 55 & 59 \\ \hline 4 & 3 & 46 & 72 \\ \hline 5 & 4 & 68 & 72 \\ \hline 6 & 5 & 53 & 68 \\ \hline 7 & 6 & 57 & 74 \\ \hline 8 & 7 & 69 & 70 \\ \hline 9 & 8 & 65 & 60 \\ \hline 10 & 9 & 55 & 73 \\ \hline 11 & 10 & 53 & 69 \\ \hline 12 & 11 & 44 & 71 \\ \hline 13 & 12 & 57 & 68 \\ \hline 14 & 13 & 71 & 64 \\ \hline 15 & 14 & 55 & 72 \\ \hline 16 & 15 & 71 & 72 \\ \hline 17 & 16 & 71 & 62 \\ \hline 18 & 17 & 63 & 73 \\ \hline \end{tabular}
