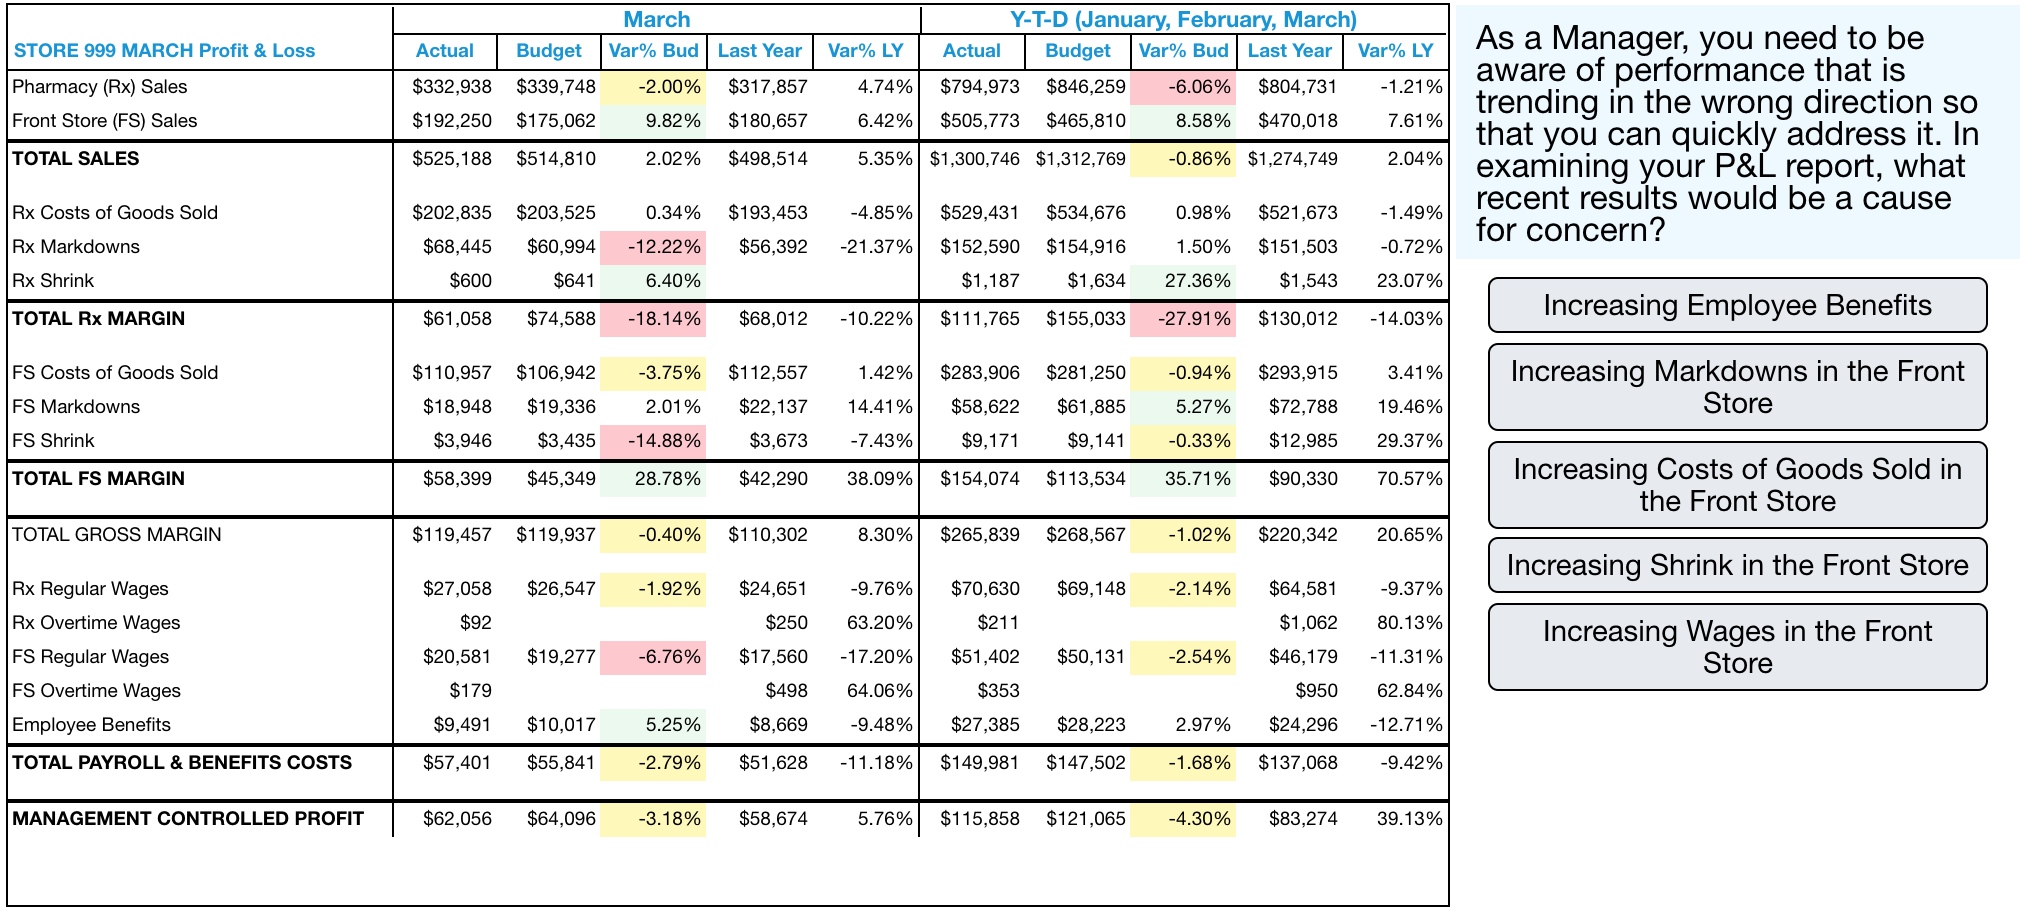
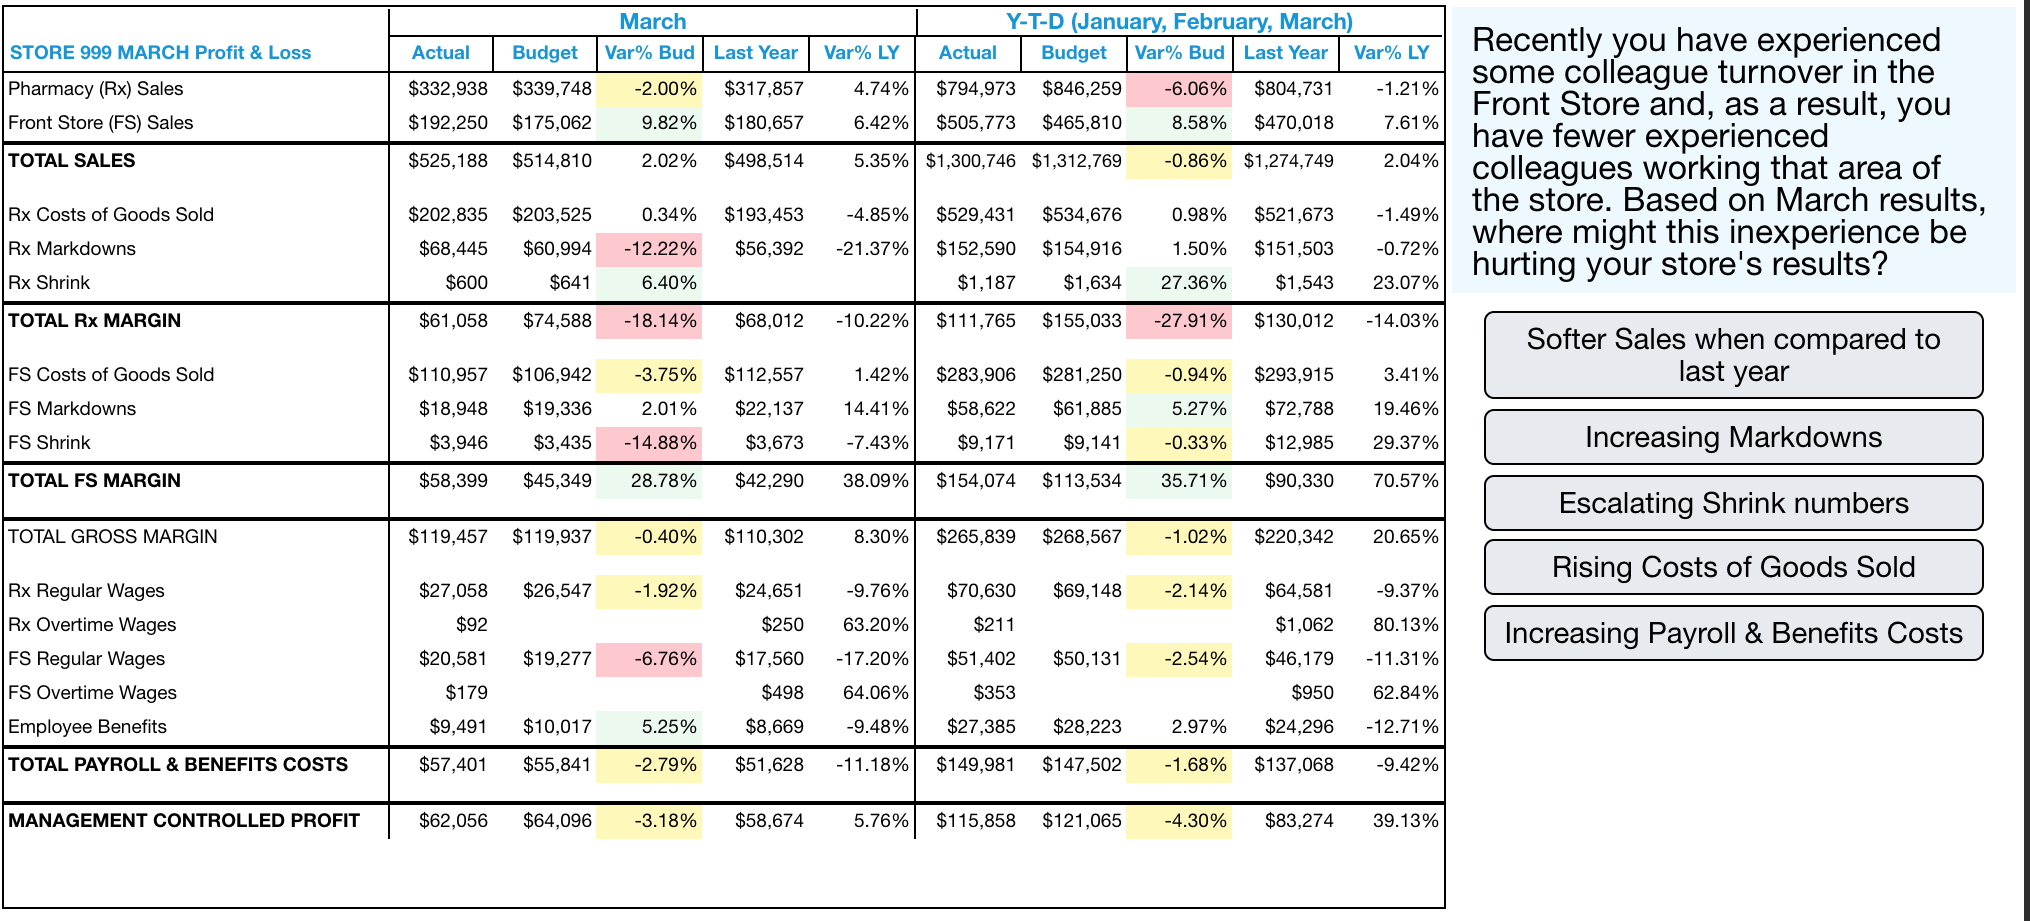
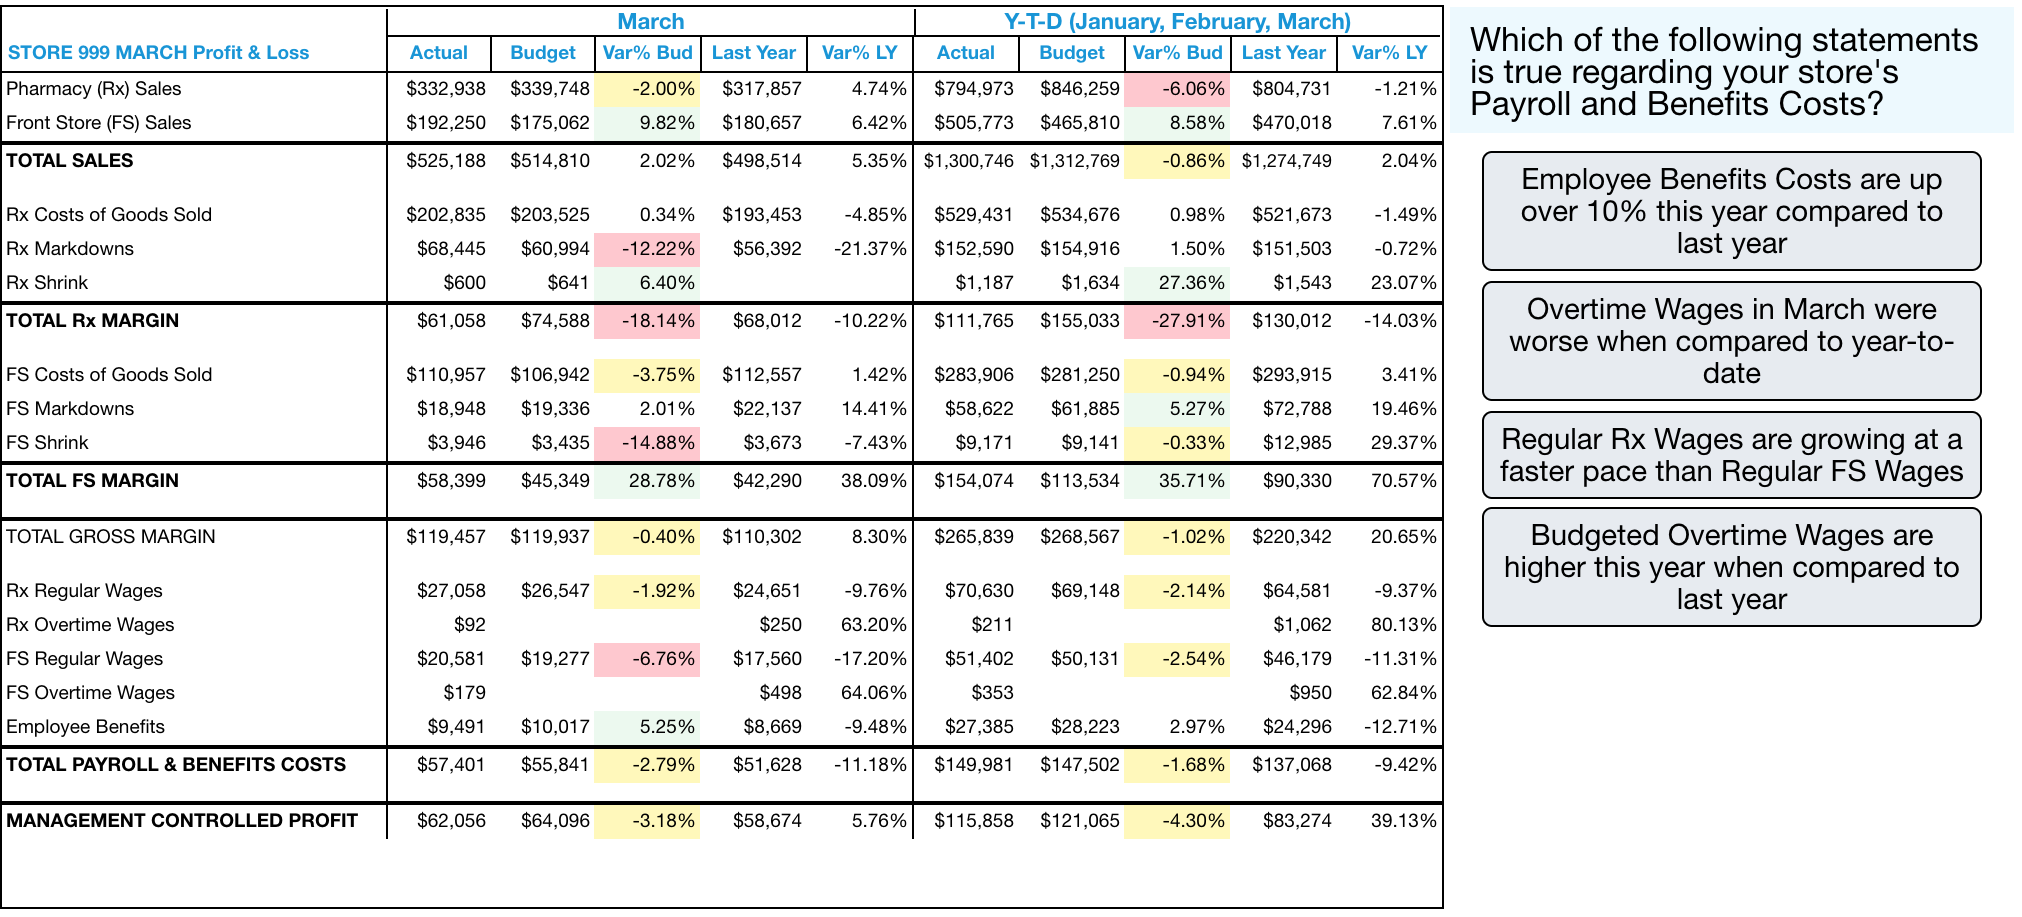
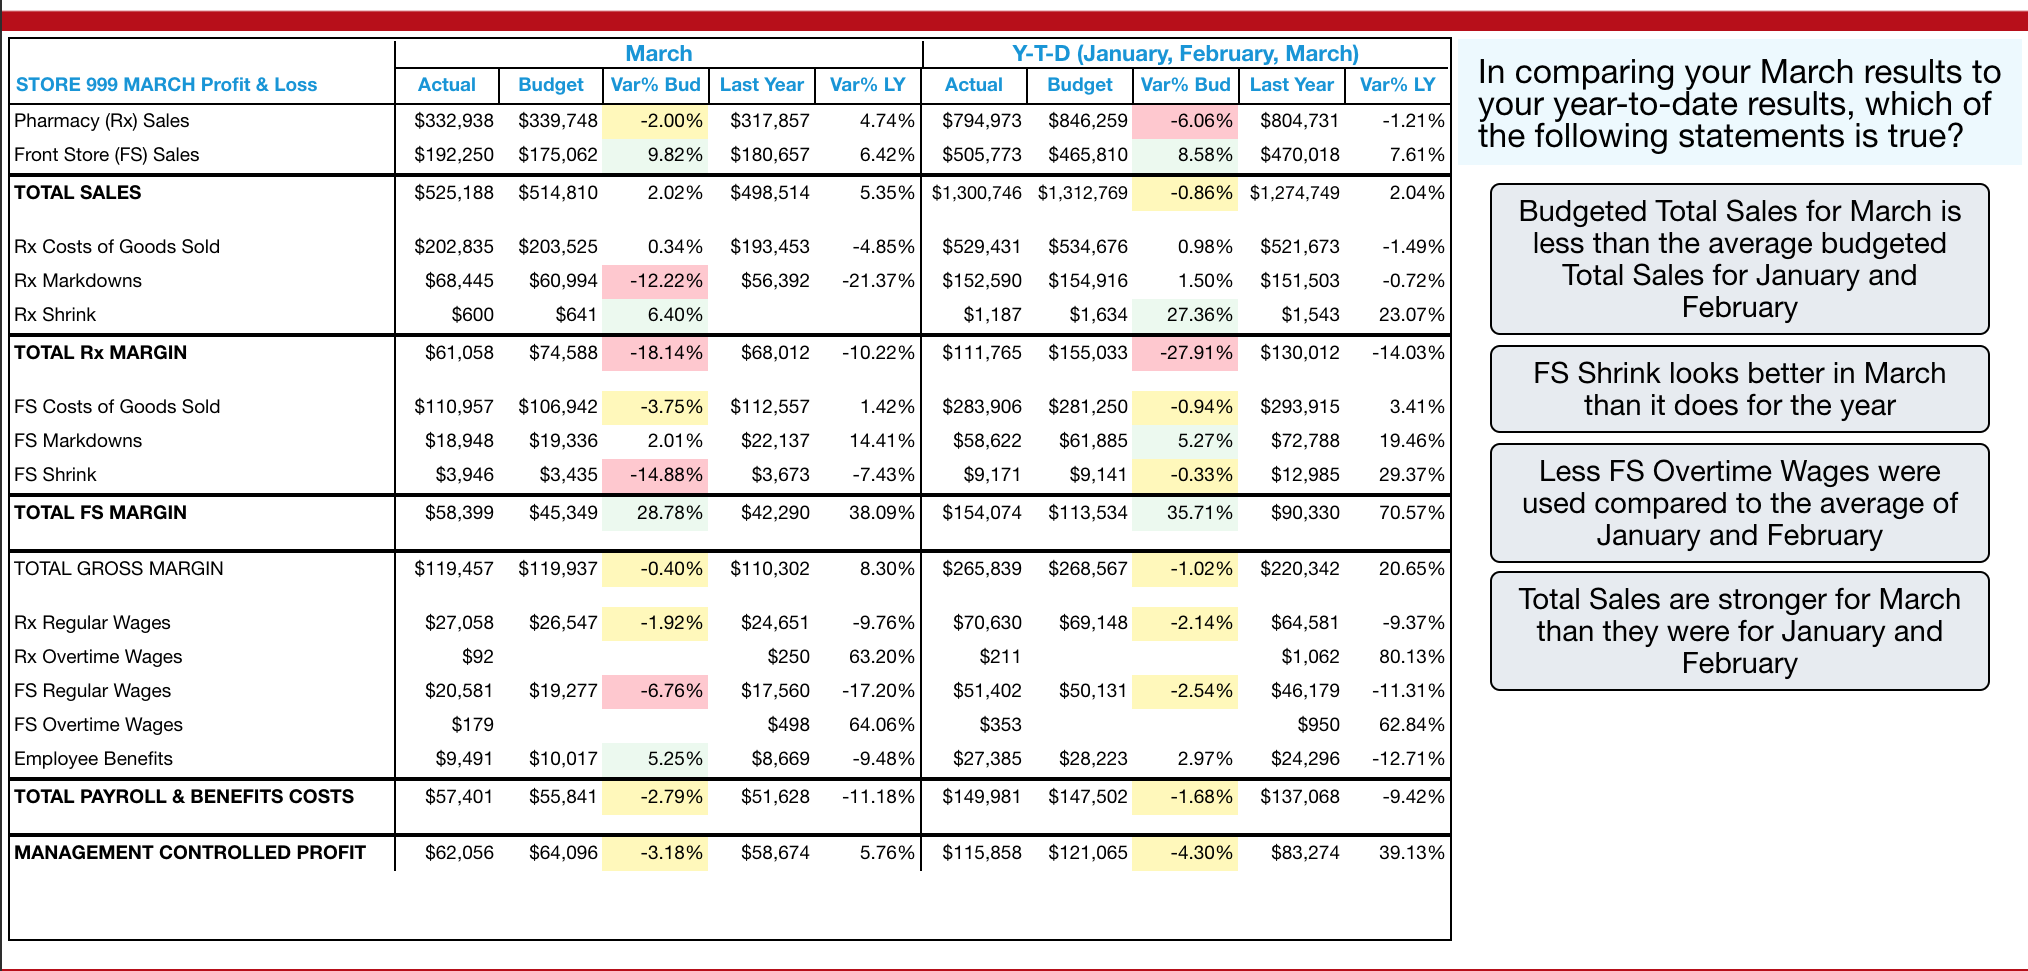
March STORE 999 MARCH Profit & Loss Actual Budget Var% Bud Last Year Var% LY Y-T-D (January, February, March) Actual Budget Var% Bud Last Year Var% LY $794,973 $846,259 -6.06% $804,731 -1.21% $505,773 $465,810 8.58% $470,018 7.61% $332,938 $339,748 -2.00% 4.74% Pharmacy (Rx) Sales Front Store (FS) Sales $317,857 $180,657 $192,250 $175,062 9.82% 6.42% As a Manager, you need to be aware of performance that is trending in the wrong direction so that you can quickly address it. In examining your P&L report, what recent results would be a cause for concern? TOTAL SALES $525,188 $514,810 2.02% $498,514 5.35% $1,300,746 $1,312,769 -0.86% $1,274,749 2.04% Rx Costs of Goods Sold 0.34% $193,453 -4.85% $534,676 0.98% $521,673 -1.49% $202,835 $68,445 $203,525 $60,994 Rx Markdowns -12.22% $56,392 -21.37% $529,431 $152,590 $1,187 1.50% -0.72% $154,916 $1,634 $151,503 $1,543 Rx Shrink $600 $641 6.40% 27.36% 23.07% Increasing Employee Benefits TOTAL Rx MARGIN $61,058 $74,588 -18.14% $68,012 -10.22% $111,765 $155,033 -27.91% $130,012 -14.03% FS Costs of Goods Sold $106,942 -3.75% $112,557 1.42% $281,250 -0.94% 3.41% $110,957 $18,948 $3,946 $283,906 $58,622 FS Markdowns Increasing Markdowns in the Front Store 2.01% 14.41% 5.27% $19,336 $3,435 19.46% $293,915 $72,788 $12,985 $22,137 $3,673 $61,885 $9,141 FS Shrink -14.88% -7.43% $9,171 -0.33% 29.37% TOTAL FS MARGIN $58,399 $45,349 28.78% $42,290 38.09% $154,074 $113,534 35.71% $90,330 70.57% Increasing Costs of Goods Sold in the Front Store TOTAL GROSS MARGIN $119,457 $119,937 -0.40% $110,302 8.30% $265,839 $268,567 -1.02% $220,342 20.65% Increasing Shrink in the Front Store $27,058 $26,547 -1.92% $24,651 -9.76% $70,630 $69,148 -2.14% $64,581 -9.37% $92 $250 63.20% $211 $1,062 80.13% Rx Regular Wages Rx Overtime Wages FS Regular Wages FS Overtime Wages Employee Benefits Increasing Wages in the Front Store $19,277 -6.76% $17,560 -17.20% $51,402 $50,131 -2.54% $46,179 -11.31% $20,581 $179 $9,491 $498 64.06% $353 $950 62.84% $10,017 5.25% $8,669 -9.48% $27,385 $28,223 2.97% $24,296 -12.71% TOTAL PAYROLL & BENEFITS COSTS $57,401 $55,841 -2.79% $51,628 -11.18% $149,981 $147,502 -1.68% $137,068 -9.42% MANAGEMENT CONTROLLED PROFIT $62,056 $64,096 -3.18% $58,674 5.76% $115,858 $121,065 -4.30% $83,274 39.13% March STORE 999 MARCH Profit & Loss Actual Budget Var% Bud Last Year Var% LY Y-T-D (January, February, March) Actual Budget Var% Bud Last Year Var% LY $794,973 $846,259 -6.06% $804,731 -1.21% $505,773 $465,810 8.58% $470,018 7.61% $339,748 -2.00% $317,857 4.74% Pharmacy (Rx) Sales Front Store (FS) Sales $332,938 $192,250 $175,062 9.82% $180,657 6.42% TOTAL SALES $525,188 $514,810 2.02% $498,514 5.35% $1,300,746 $1,312,769 -0.86% $1,274,749 2.04% Recently you have experienced some colleague turnover in the Front Store and, as a result, you have fewer experienced colleagues working that area of the store. Based on March results, where might this inexperience be hurting your store's results? Rx Costs of Goods Sold 0.34% $193,453 -4.85% $529,431 $534,676 0.98% -1.49% $202,835 $203,525 $68,445 $60,994 Rx Markdowns - 12.22% $56,392 -21.37% 1.50% $152,590 $1,187 -0.72% $521,673 $151,503 $1,543 $154,916 $1,634 Rx Shrink $600 $641 6.40% 27.36% 23.07% TOTAL Rx MARGIN $61,058 $74,588 -18.14% $68,012 -10.22% $111,765 $155,033 -27.91% $130,012 -14.03% Softer Sales when compared to FS Costs of Goods Sold $106,942 -3.75% $112,557 1.42% $283,906 $281,250 -0.94% $293,915 3.41% last year FS Markdowns $110,957 $18,948 $3,946 $19,336 2.01% 14.41% $58,622 5.27% $72,788 19.46% $22,137 $3,673 $61,885 $9,141 FS Shrink $3,435 -14.88% -7.43% $9,171 -0.33% $12,985 29.37% Increasing Markdowns TOTAL FS MARGIN $58,399 $45,349 28.78% $42,290 38.09% $154,074 $113,534 35.71% $90,330 70.57% Escalating Shrink numbers TOTAL GROSS MARGIN $119,457 $119,937 -0.40% $110,302 8.30% $265,839 $268,567 -1.02% $220,342 20.65% Rising Costs of Goods Sold $27,058 $26,547 -1.92% $24,651 -9.76% $70,630 $69,148 -2.14% $64,581 -9.37% $92 $250 63.20% $211 80.13% $1,062 $46,179 Increasing Payroll & Benefits Costs $20,581 $19,277 -6.76% -17.20% $50,131 -2.54% Rx Regular Wages Rx Overtime Wages FS Regular Wages FS Overtime Wages Employee Benefits TOTAL PAYROLL & BENEFITS COSTS $17,560 $498 $8,669 $51,402 $353 $179 $9,491 64.06% $950 $24,296 -11.31% 62.84% -12.71% $10,017 5.25% -9.48% $27,385 $28,223 2.97% $57,401 $55,841 -2.79% $51,628 -11.18% $149,981 $147,502 -1.68% $137,068 -9.42% MANAGEMENT CONTROLLED PROFIT $62,056 $64,096 -3.18% $58,674 5.76% $115,858 $121,065 -4.30% $83,274 39.13% March STORE 999 MARCH Profit & Loss Actual Budget Var% Bud Last Year Var% LY Y-T-D (January, February, March) Actual Budget Var% Bud Last Year Var% LY $794,973 $846,259 -6.06% $804,731 -1.21% $505,773 $465,810 8.58% $470,018 7.61% Which of the following statements is true regarding your store's Payroll and Benefits Costs? -2.00% $317,857 4.74% Pharmacy (Rx) Sales Front Store (FS) Sales $332,938 $192,250 $339,748 $175,062 9.82% $180,657 6.42% TOTAL SALES $525,188 $514,810 2.02% $498,514 5.35% $1,300,746 $1,312,769 -0.86% $1,274,749 2.04% Employee Benefits Costs are up over 10% this year compared to Rx Costs of Goods Sold $203,525 0.34% -4.85% $529,431 $534,676 0.98% -1.49% $202,835 $68,445 $600 $193,453 $56,392 Rx Markdowns $60,994 -12.22% -21.37% 1.50% -0.72% $521,673 $151,503 $1,543 $152,590 $1,187 last year $154,916 $1,634 Rx Shrink $641 6.40% 27.36% 23.07% TOTAL Rx MARGIN $61,058 $74,588 -18.14% $68,012 -10.22% $111,765 $155,033 -27.91% $130,012 -14.03% Overtime Wages in March were worse when compared to year-to- date FS Costs of Goods Sold $106,942 -3.75% $112,557 1.42% $283,906 $281,250 -0.94% 3.41% $110,957 $18,948 $3,946 $293,915 $72,788 FS Markdowns $19,336 14.41% $58,622 5.27% 19.46% 2.01% -14.88% $22,137 $3,673 $61,885 $9,141 FS Shrink $3,435 -7.43% $9,171 -0.33% $12,985 29.37% Regular Rx Wages are growing at a faster pace than Regular FS Wages TOTAL FS MARGIN $58,399 $45,349 28.78% $42,290 38.09% $154,074 $113,534 35.71% $90,330 70.57% TOTAL GROSS MARGIN $119,457 $119,937 -0.40% $110,302 8.30% $265,839 $268,567 -1.02% $220,342 20.65% Budgeted Overtime Wages are higher this year when compared to $27,058 $26,547 -1.92% $24,651 -9.76% $70,630 $69,148 -2.14% $64,581 -9.37% last year $92 $250 63.20% $211 $1,062 80.13% Rx Regular Wages Rx Overtime Wages FS Regular Wages FS Overtime Wages Employee Benefits $20,581 $19,277 -6.76% -17.20% $50,131 -2.54% -11.31% $17,560 $498 $8,669 $51,402 $353 $46,179 $950 $179 64.06% 62.84% $9,491 $10,017 5.25% -9.48% $27,385 $28,223 2.97% $24,296 -12.71% TOTAL PAYROLL & BENEFITS COSTS $57,401 $55,841 -2.79% $51,628 -11.18% $149,981 $147,502 -1.68% $137,068 -9.42% MANAGEMENT CONTROLLED PROFIT $62,056 $64,096 -3.18% $58,674 5.76% $115,858 $121,065 -4.30% $83,274 39.13% March Var% Bud Last Year STORE 999 MARCH Profit & Loss Actual Budget Var% LY Y-T-D (January, February, March) Actual Budget Var% Bud Last Year Var% LY $794,973 $846,259 -6.06% $804,731 -1.21% $505,773 $465,810 8.58% $470,018 7.61% In comparing your March results to your year-to-date results, which of the following statements is true? $339,748 -2.00% $317,857 4.74% Pharmacy (Rx) Sales Front Store (FS) Sales $332,938 $192,250 $175,062 9.82% $180,657 6.42% TOTAL SALES $525,188 $514,810 2.02% $498,514 5.35% $1,300,746 $1,312,769 -0.86% $1,274,749 2.04% Rx Costs of Goods Sold 0.34% $193,453 -4.85% 0.98% -1.49% $202,835 $203,525 $68,445 $60,994 $600 $641 $534,676 $154,916 Rx Markdowns Budgeted Total Sales for March is less than the average budgeted Total Sales for January and February - 12.22% $529,431 $152,590 $1,187 $56,392 -21.37% $521,673 $151,503 $1,543 1.50% -0.72% Rx Shrink 6.40% $1.634 27.36% 23.07% TOTAL Rx MARGIN $61,058 $74,588 -18.14% $68,012 -10.22% $111,765 $155,033 -27.91% $130,012 -14.03% FS Shrink looks better in March than it does for the year FS Costs of Goods Sold -3.75% 1.42% $281,250 -0.94% $293,915 3.41% $110,957 $18,948 $106,942 $19,336 $3,435 $112,557 $22,137 $283,906 $58,622 FS Markdowns 2.01% 14.41% $61,885 5.27% 19.46% $72,788 $12,985 FS Shrink $3,946 -14.88% $3,673 -7.43% $9,171 $9,141 -0.33% 29.37% TOTAL FS MARGIN $58,399 $45,349 28.78% $42,290 38.09% $154,074 $113,534 35.71% $90,330 70.57% Less FS Overtime Wages were used compared to the average of January and February TOTAL GROSS MARGIN $119,457 $119,937 -0.40% $110,302 8.30% $265,839 $268,567 -1.02% $220,342 20.65% $27,058 $26,547 -1.92% $24,651 -9.76% $70,630 $69,148 -2.14% $64,581 -9.37% Total Sales are stronger for March than they were for January and February $92 $250 63.20% $211 $1,062 80.13% Rx Regular Wages Rx Overtime Wages FS Regular Wages FS Overtime Wages Employee Benefits $19,277 -6.76% -17.20% $50, 131 -2.54% -11.31% $20,581 $179 $17,560 $498 64.06% $51,402 $353 $27,385 $46,179 $950 $24,296 62.84% $9,491 $10,017 5.25% $8,669 -9.48% $28,223 2.97% -12.71% TOTAL PAYROLL & BENEFITS COSTS $57,401 $55,841 -2.79% $51,628 -11.18% $149,981 $147,502 -1.68% $137,068 -9.42% MANAGEMENT CONTROLLED PROFIT $62,056 $64,096 -3.18% $58,674 5.76% $115,858 $121,065 -4.30% $83,274 39.13% March STORE 999 MARCH Profit & Loss Actual Budget Var% Bud Last Year Var% LY Y-T-D (January, February, March) Actual Budget Var% Bud Last Year Var% LY $794,973 $846,259 -6.06% $804,731 -1.21% $505,773 $465,810 8.58% $470,018 7.61% $332,938 $339,748 -2.00% 4.74% Pharmacy (Rx) Sales Front Store (FS) Sales $317,857 $180,657 $192,250 $175,062 9.82% 6.42% As a Manager, you need to be aware of performance that is trending in the wrong direction so that you can quickly address it. In examining your P&L report, what recent results would be a cause for concern? TOTAL SALES $525,188 $514,810 2.02% $498,514 5.35% $1,300,746 $1,312,769 -0.86% $1,274,749 2.04% Rx Costs of Goods Sold 0.34% $193,453 -4.85% $534,676 0.98% $521,673 -1.49% $202,835 $68,445 $203,525 $60,994 Rx Markdowns -12.22% $56,392 -21.37% $529,431 $152,590 $1,187 1.50% -0.72% $154,916 $1,634 $151,503 $1,543 Rx Shrink $600 $641 6.40% 27.36% 23.07% Increasing Employee Benefits TOTAL Rx MARGIN $61,058 $74,588 -18.14% $68,012 -10.22% $111,765 $155,033 -27.91% $130,012 -14.03% FS Costs of Goods Sold $106,942 -3.75% $112,557 1.42% $281,250 -0.94% 3.41% $110,957 $18,948 $3,946 $283,906 $58,622 FS Markdowns Increasing Markdowns in the Front Store 2.01% 14.41% 5.27% $19,336 $3,435 19.46% $293,915 $72,788 $12,985 $22,137 $3,673 $61,885 $9,141 FS Shrink -14.88% -7.43% $9,171 -0.33% 29.37% TOTAL FS MARGIN $58,399 $45,349 28.78% $42,290 38.09% $154,074 $113,534 35.71% $90,330 70.57% Increasing Costs of Goods Sold in the Front Store TOTAL GROSS MARGIN $119,457 $119,937 -0.40% $110,302 8.30% $265,839 $268,567 -1.02% $220,342 20.65% Increasing Shrink in the Front Store $27,058 $26,547 -1.92% $24,651 -9.76% $70,630 $69,148 -2.14% $64,581 -9.37% $92 $250 63.20% $211 $1,062 80.13% Rx Regular Wages Rx Overtime Wages FS Regular Wages FS Overtime Wages Employee Benefits Increasing Wages in the Front Store $19,277 -6.76% $17,560 -17.20% $51,402 $50,131 -2.54% $46,179 -11.31% $20,581 $179 $9,491 $498 64.06% $353 $950 62.84% $10,017 5.25% $8,669 -9.48% $27,385 $28,223 2.97% $24,296 -12.71% TOTAL PAYROLL & BENEFITS COSTS $57,401 $55,841 -2.79% $51,628 -11.18% $149,981 $147,502 -1.68% $137,068 -9.42% MANAGEMENT CONTROLLED PROFIT $62,056 $64,096 -3.18% $58,674 5.76% $115,858 $121,065 -4.30% $83,274 39.13% March STORE 999 MARCH Profit & Loss Actual Budget Var% Bud Last Year Var% LY Y-T-D (January, February, March) Actual Budget Var% Bud Last Year Var% LY $794,973 $846,259 -6.06% $804,731 -1.21% $505,773 $465,810 8.58% $470,018 7.61% $339,748 -2.00% $317,857 4.74% Pharmacy (Rx) Sales Front Store (FS) Sales $332,938 $192,250 $175,062 9.82% $180,657 6.42% TOTAL SALES $525,188 $514,810 2.02% $498,514 5.35% $1,300,746 $1,312,769 -0.86% $1,274,749 2.04% Recently you have experienced some colleague turnover in the Front Store and, as a result, you have fewer experienced colleagues working that area of the store. Based on March results, where might this inexperience be hurting your store's results? Rx Costs of Goods Sold 0.34% $193,453 -4.85% $529,431 $534,676 0.98% -1.49% $202,835 $203,525 $68,445 $60,994 Rx Markdowns - 12.22% $56,392 -21.37% 1.50% $152,590 $1,187 -0.72% $521,673 $151,503 $1,543 $154,916 $1,634 Rx Shrink $600 $641 6.40% 27.36% 23.07% TOTAL Rx MARGIN $61,058 $74,588 -18.14% $68,012 -10.22% $111,765 $155,033 -27.91% $130,012 -14.03% Softer Sales when compared to FS Costs of Goods Sold $106,942 -3.75% $112,557 1.42% $283,906 $281,250 -0.94% $293,915 3.41% last year FS Markdowns $110,957 $18,948 $3,946 $19,336 2.01% 14.41% $58,622 5.27% $72,788 19.46% $22,137 $3,673 $61,885 $9,141 FS Shrink $3,435 -14.88% -7.43% $9,171 -0.33% $12,985 29.37% Increasing Markdowns TOTAL FS MARGIN $58,399 $45,349 28.78% $42,290 38.09% $154,074 $113,534 35.71% $90,330 70.57% Escalating Shrink numbers TOTAL GROSS MARGIN $119,457 $119,937 -0.40% $110,302 8.30% $265,839 $268,567 -1.02% $220,342 20.65% Rising Costs of Goods Sold $27,058 $26,547 -1.92% $24,651 -9.76% $70,630 $69,148 -2.14% $64,581 -9.37% $92 $250 63.20% $211 80.13% $1,062 $46,179 Increasing Payroll & Benefits Costs $20,581 $19,277 -6.76% -17.20% $50,131 -2.54% Rx Regular Wages Rx Overtime Wages FS Regular Wages FS Overtime Wages Employee Benefits TOTAL PAYROLL & BENEFITS COSTS $17,560 $498 $8,669 $51,402 $353 $179 $9,491 64.06% $950 $24,296 -11.31% 62.84% -12.71% $10,017 5.25% -9.48% $27,385 $28,223 2.97% $57,401 $55,841 -2.79% $51,628 -11.18% $149,981 $147,502 -1.68% $137,068 -9.42% MANAGEMENT CONTROLLED PROFIT $62,056 $64,096 -3.18% $58,674 5.76% $115,858 $121,065 -4.30% $83,274 39.13% March STORE 999 MARCH Profit & Loss Actual Budget Var% Bud Last Year Var% LY Y-T-D (January, February, March) Actual Budget Var% Bud Last Year Var% LY $794,973 $846,259 -6.06% $804,731 -1.21% $505,773 $465,810 8.58% $470,018 7.61% Which of the following statements is true regarding your store's Payroll and Benefits Costs? -2.00% $317,857 4.74% Pharmacy (Rx) Sales Front Store (FS) Sales $332,938 $192,250 $339,748 $175,062 9.82% $180,657 6.42% TOTAL SALES $525,188 $514,810 2.02% $498,514 5.35% $1,300,746 $1,312,769 -0.86% $1,274,749 2.04% Employee Benefits Costs are up over 10% this year compared to Rx Costs of Goods Sold $203,525 0.34% -4.85% $529,431 $534,676 0.98% -1.49% $202,835 $68,445 $600 $193,453 $56,392 Rx Markdowns $60,994 -12.22% -21.37% 1.50% -0.72% $521,673 $151,503 $1,543 $152,590 $1,187 last year $154,916 $1,634 Rx Shrink $641 6.40% 27.36% 23.07% TOTAL Rx MARGIN $61,058 $74,588 -18.14% $68,012 -10.22% $111,765 $155,033 -27.91% $130,012 -14.03% Overtime Wages in March were worse when compared to year-to- date FS Costs of Goods Sold $106,942 -3.75% $112,557 1.42% $283,906 $281,250 -0.94% 3.41% $110,957 $18,948 $3,946 $293,915 $72,788 FS Markdowns $19,336 14.41% $58,622 5.27% 19.46% 2.01% -14.88% $22,137 $3,673 $61,885 $9,141 FS Shrink $3,435 -7.43% $9,171 -0.33% $12,985 29.37% Regular Rx Wages are growing at a faster pace than Regular FS Wages TOTAL FS MARGIN $58,399 $45,349 28.78% $42,290 38.09% $154,074 $113,534 35.71% $90,330 70.57% TOTAL GROSS MARGIN $119,457 $119,937 -0.40% $110,302 8.30% $265,839 $268,567 -1.02% $220,342 20.65% Budgeted Overtime Wages are higher this year when compared to $27,058 $26,547 -1.92% $24,651 -9.76% $70,630 $69,148 -2.14% $64,581 -9.37% last year $92 $250 63.20% $211 $1,062 80.13% Rx Regular Wages Rx Overtime Wages FS Regular Wages FS Overtime Wages Employee Benefits $20,581 $19,277 -6.76% -17.20% $50,131 -2.54% -11.31% $17,560 $498 $8,669 $51,402 $353 $46,179 $950 $179 64.06% 62.84% $9,491 $10,017 5.25% -9.48% $27,385 $28,223 2.97% $24,296 -12.71% TOTAL PAYROLL & BENEFITS COSTS $57,401 $55,841 -2.79% $51,628 -11.18% $149,981 $147,502 -1.68% $137,068 -9.42% MANAGEMENT CONTROLLED PROFIT $62,056 $64,096 -3.18% $58,674 5.76% $115,858 $121,065 -4.30% $83,274 39.13% March Var% Bud Last Year STORE 999 MARCH Profit & Loss Actual Budget Var% LY Y-T-D (January, February, March) Actual Budget Var% Bud Last Year Var% LY $794,973 $846,259 -6.06% $804,731 -1.21% $505,773 $465,810 8.58% $470,018 7.61% In comparing your March results to your year-to-date results, which of the following statements is true? $339,748 -2.00% $317,857 4.74% Pharmacy (Rx) Sales Front Store (FS) Sales $332,938 $192,250 $175,062 9.82% $180,657 6.42% TOTAL SALES $525,188 $514,810 2.02% $498,514 5.35% $1,300,746 $1,312,769 -0.86% $1,274,749 2.04% Rx Costs of Goods Sold 0.34% $193,453 -4.85% 0.98% -1.49% $202,835 $203,525 $68,445 $60,994 $600 $641 $534,676 $154,916 Rx Markdowns Budgeted Total Sales for March is less than the average budgeted Total Sales for January and February - 12.22% $529,431 $152,590 $1,187 $56,392 -21.37% $521,673 $151,503 $1,543 1.50% -0.72% Rx Shrink 6.40% $1.634 27.36% 23.07% TOTAL Rx MARGIN $61,058 $74,588 -18.14% $68,012 -10.22% $111,765 $155,033 -27.91% $130,012 -14.03% FS Shrink looks better in March than it does for the year FS Costs of Goods Sold -3.75% 1.42% $281,250 -0.94% $293,915 3.41% $110,957 $18,948 $106,942 $19,336 $3,435 $112,557 $22,137 $283,906 $58,622 FS Markdowns 2.01% 14.41% $61,885 5.27% 19.46% $72,788 $12,985 FS Shrink $3,946 -14.88% $3,673 -7.43% $9,171 $9,141 -0.33% 29.37% TOTAL FS MARGIN $58,399 $45,349 28.78% $42,290 38.09% $154,074 $113,534 35.71% $90,330 70.57% Less FS Overtime Wages were used compared to the average of January and February TOTAL GROSS MARGIN $119,457 $119,937 -0.40% $110,302 8.30% $265,839 $268,567 -1.02% $220,342 20.65% $27,058 $26,547 -1.92% $24,651 -9.76% $70,630 $69,148 -2.14% $64,581 -9.37% Total Sales are stronger for March than they were for January and February $92 $250 63.20% $211 $1,062 80.13% Rx Regular Wages Rx Overtime Wages FS Regular Wages FS Overtime Wages Employee Benefits $19,277 -6.76% -17.20% $50, 131 -2.54% -11.31% $20,581 $179 $17,560 $498 64.06% $51,402 $353 $27,385 $46,179 $950 $24,296 62.84% $9,491 $10,017 5.25% $8,669 -9.48% $28,223 2.97% -12.71% TOTAL PAYROLL & BENEFITS COSTS $57,401 $55,841 -2.79% $51,628 -11.18% $149,981 $147,502 -1.68% $137,068 -9.42% MANAGEMENT CONTROLLED PROFIT $62,056 $64,096 -3.18% $58,674 5.76% $115,858 $121,065 -4.30% $83,274 39.13%