

Question
Marilyn was interested in the effects of journal therapy on depression. She randomly assigned 60 individuals who had been clinically diagnosed as having severe depression
Marilyn was interested in the effects of journal therapy on depression. She randomly assigned 60 individuals who had been clinically diagnosed as having severe depression to three treatment groups. Individuals in the first group wrote intensively about their feelings in journals for an hour each day for three weeks and received regular counseling (J+C). The second group received only journal therapy (J), and the third group received only regular counseling (C). All 60 participants were given a depression test before and after treatment.
The research questions are:
? Mean differences: Do depression scores differ for those who received J+C, J, or C, assuming no prior differences in depression among the groups?
? Relationship between variables: Is there a relationship between the different types of treatment and depression, holding constant baseline depression prior to treatment?
SPSS Data - Journal TherapyDownload SPSS Data - Journal Therapy
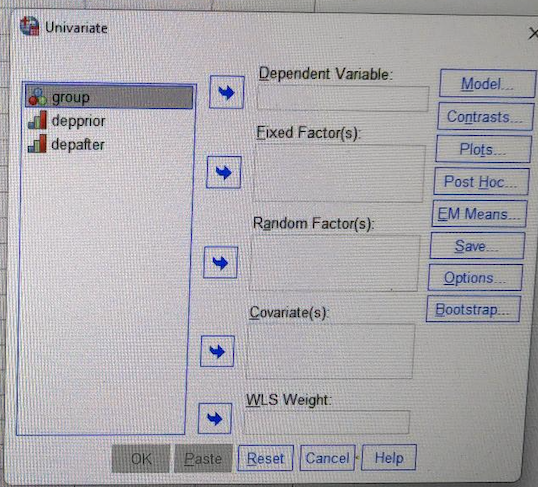
1. Open the SPSS data file Journal Therapy (link above) which contains 60 cases and 3 variables (Factor/group, depression pretest, depression posttest).
2. Conduct a one-way ANCOVA using GLM > Univariate to test the effectiveness of journal therapy on depression. The null hypothesis is whether the population means on the DV are equal across levels of the IV, adjusting for differences in the CV.
3. Base on the study design and SPSS output, answer the following questions:
a) Which variable is the factor, covariate, and dependent variable?
b) What is your research hypothesis? In other words, if you expect there are group differences, which treatment will be most effective for lowering depression scores and why?
c) Why do we want to statistically control for baseline depression (depression pretest)?
d) What is the result of the homogeneity of slopes assumption test?
e) Examine the means in the Descriptives Statistics table (these are the unadjusted means). Does it appear that there are group differences within each levels of the factor? If so, which group scored better after the treatment? (lower value = lower level of depression)
f) What is the sig. or p value of the Levene's test?Is the homogeneity of variance assumption met?
h) Can you reject the null hypothesis that the population adjusted means are equal?
i) Should you interpret the pairwise comparisons? Why or why not?
j) Examine the Estimated Marginal Means table. How do these adjusted mean depression scores compare to the unadjusted mean scores?
Step by Step Solution
There are 3 Steps involved in it
Step: 1

Get Instant Access to Expert-Tailored Solutions
See step-by-step solutions with expert insights and AI powered tools for academic success
Step: 2

Step: 3
Ace Your Homework with AI
Get the answers you need in no time with our AI-driven, step-by-step assistance
Get Started
Advances In Mathematical Economics Volume 19
Authors: Shigeo Kusuoka, Toru Maruyama
1st Edition
4431554890, 9784431554899