Answered step by step
Verified Expert Solution
Question
1 Approved Answer
MARKET BASKET COMPARISON (JUNE 1, 1978) Approximate difference City Food Cost Tax (if any) Total from U.S. average Tampa $32.58 0-0 $32.58 Des Moines $33.80
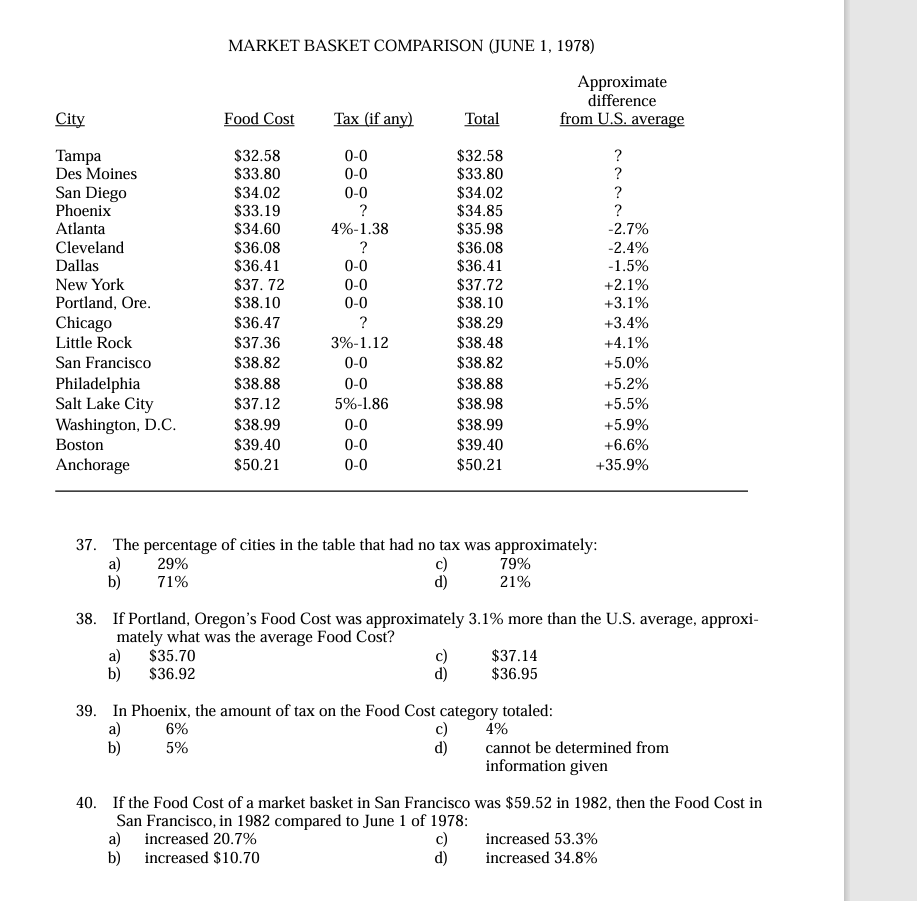
MARKET BASKET COMPARISON (JUNE 1, 1978) Approximate difference City Food Cost Tax (if any) Total from U.S. average Tampa $32.58 0-0 $32.58 Des Moines $33.80 0-0 $33.80 San Diego $34.02 0-0 $34.02 Phoenix $33.19 ? $34.85 Atlanta $34.60 4%-1.38 $35.98 2.7% Cleveland $36.08 ? $36.08 2.4% Dallas $36.41 0-0 $36.41 -1.5% New York $37. 72 0-0 $37.72 +2.1% Portland, Ore. $38.10 0-0 $38.10 +3.1% Chicago $36.47 $38.29 +3.4% Little Rock $37.36 3%-1.12 $38.48 +4.1% San Francisco $38.82 0-0 $38.82 +5.0% Philadelphia $38.88 0-0 $38.88 +5.2% Salt Lake City $37.12 5%-1.86 $38.98 +5.5% Washington, D.C. $38.99 0-0 $38.99 +5.9% Boston $39.40 0-0 $39.40 +6.6% Anchorage $50.21 0-0 $50.21 +35.9% 37. The percentage of cities in the table that had no tax was approximately: 29% 79% 71% e 21% 38. If Portland, Oregon's Food Cost was approximately 3.1% more than the U.S. average, approxi- mately what was the average Food Cost? a) $35.70 $37.14 $36.92 $36.95 39. In Phoenix, the amount of tax on the Food Cost category totaled: 6% c) 4% b) 5% e. cannot be determined from information given . If the Food Cost of a market basket in San Francisco was $59.52 in 1982, then the Food Cost in San Francisco, in 1982 compared to June 1 of 1978: a) increased 20.7% increased 53.3% b) increased $10.70 d) increased 34.8%
Step by Step Solution
There are 3 Steps involved in it
Step: 1
Get Instant Access to Expert-Tailored Solutions
See step-by-step solutions with expert insights and AI powered tools for academic success
Step: 2
Step: 3
Ace Your Homework with AI
Get the answers you need in no time with our AI-driven, step-by-step assistance
Get Started