please please please help me
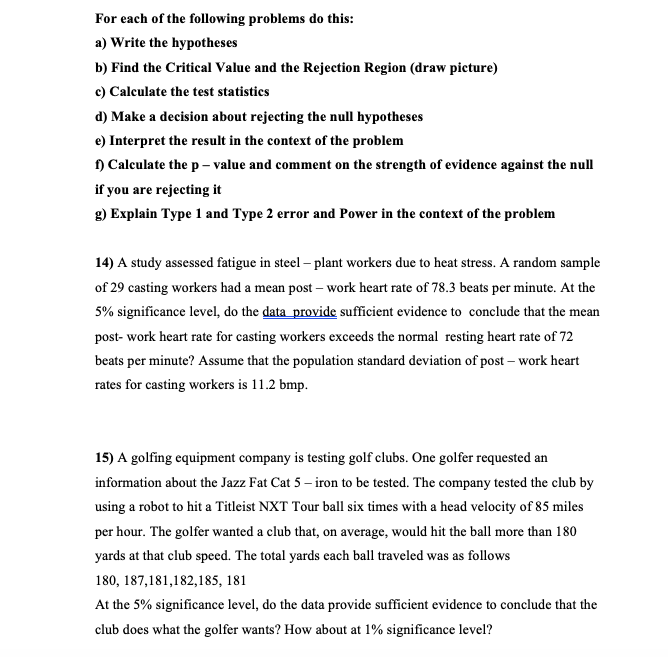
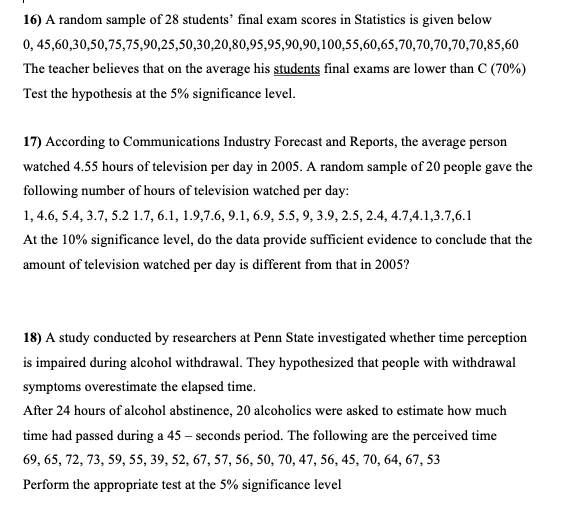
For each of the following problems do this: a) Write the hypotheses b) Find the Critical Value and the Rejection Region (draw picture) c) Calculate the test statistics d) Make a decision about rejecting the null hypotheses e) Interpret the result in the context of the problem f) Calculate the p - value and comment on the strength of evidence against the null if you are rejecting it g) Explain Type 1 and Type 2 error and Power in the context of the problem 14) A study assessed fatigue in steel - plant workers due to heat stress. A random sample of 29 casting workers had a mean post - work heart rate of 78.3 beats per minute. At the 5% significance level, do the data provide sufficient evidence to conclude that the mean post- work heart rate for casting workers exceeds the normal resting heart rate of 72 beats per minute? Assume that the population standard deviation of post - work heart rates for casting workers is 11.2 bmp. 15) A golfing equipment company is testing golf clubs. One golfer requested an information about the Jazz Fat Cat 5 - iron to be tested. The company tested the club by using a robot to hit a Titleist NXT Tour ball six times with a head velocity of 85 miles per hour. The golfer wanted a club that, on average, would hit the ball more than 180 yards at that club speed. The total yards each ball traveled was as follows 180, 187,181,182,185, 181 At the 5% significance level, do the data provide sufficient evidence to conclude that the club does what the golfer wants? How about at 1% significance level?16) A random sample of 28 students' final exam scores in Statistics is given below 0, 45,60,30,50,75,75,90,25,50,30,20,80,95,95,90,90,100,55,60,65,70,70,70,70,70,85,60 The teacher believes that on the average his students final exams are lower than C (70%) Test the hypothesis at the 5% significance level. 17) According to Communications Industry Forecast and Reports, the average person watched 4.55 hours of television per day in 2005. A random sample of 20 people gave the following number of hours of television watched per day: 1, 4.6, 5.4, 3.7, 5.2 1.7, 6.1, 1.9,7.6, 9.1, 6.9, 5.5, 9, 3.9, 2.5, 2.4, 4.7,4.1,3.7,6.1 At the 10% significance level, do the data provide sufficient evidence to conclude that the amount of television watched per day is different from that in 2005? 18) A study conducted by researchers at Penn State investigated whether time perception is impaired during alcohol withdrawal. They hypothesized that people with withdrawal symptoms overestimate the elapsed time. After 24 hours of alcohol abstinence, 20 alcoholics were asked to estimate how much time had passed during a 45 - seconds period. The following are the perceived time 69, 65, 72, 73, 59, 55, 39, 52, 67, 57, 56, 50, 70, 47, 56, 45, 70, 64, 67, 53 Perform the appropriate test at the 5% significance level


