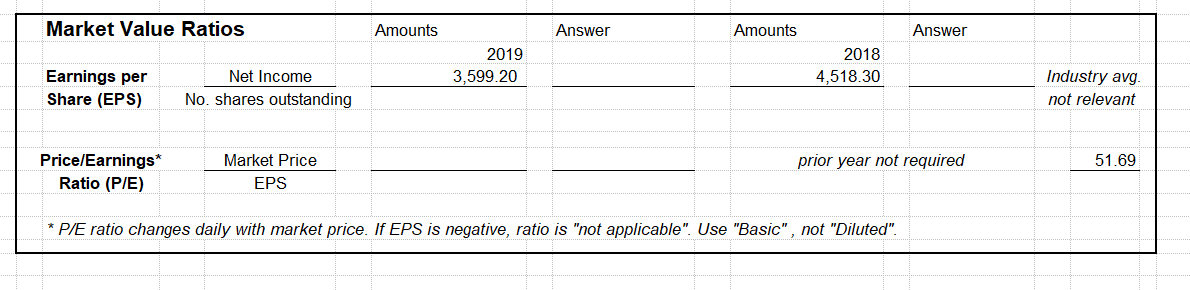
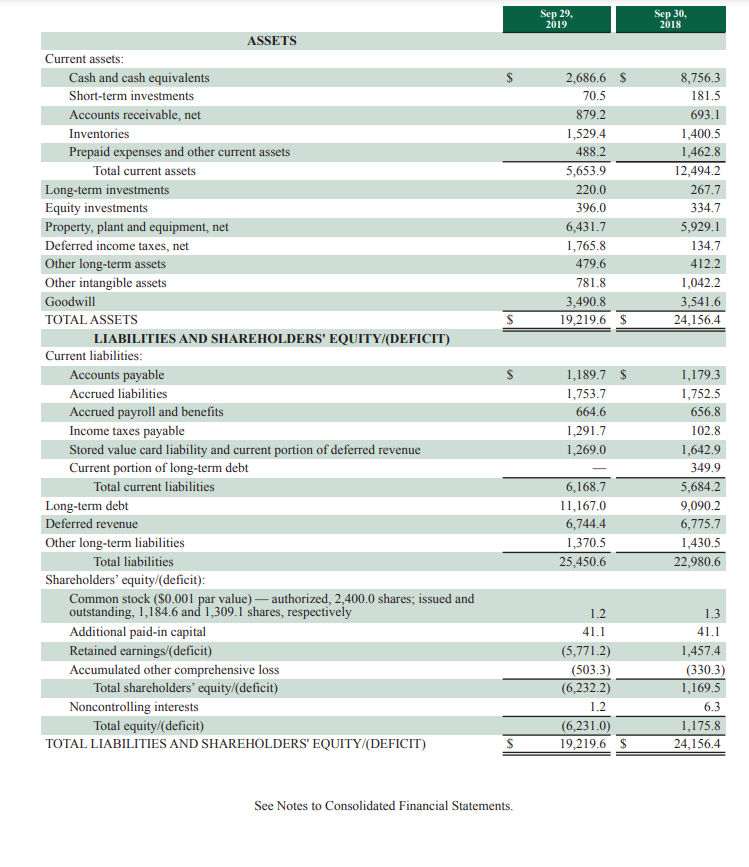
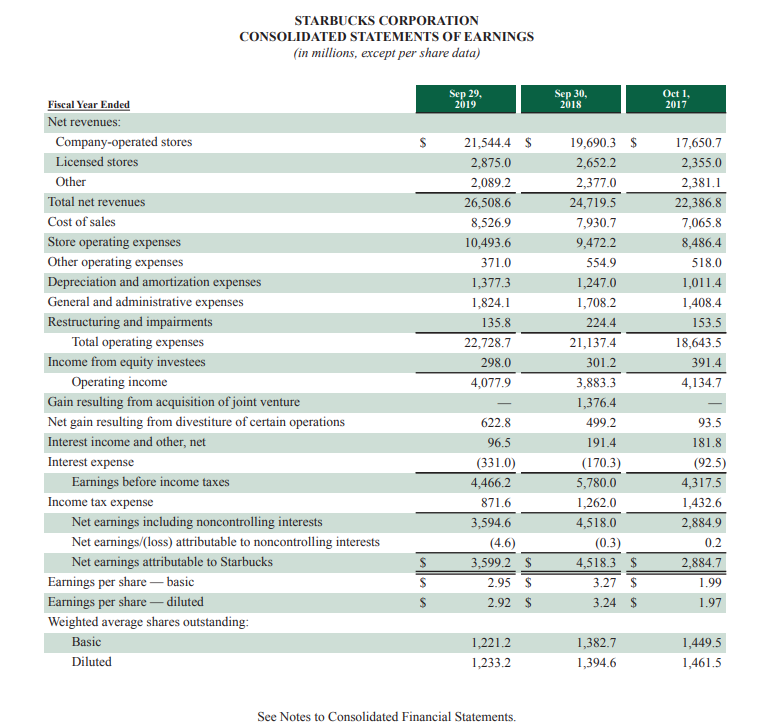
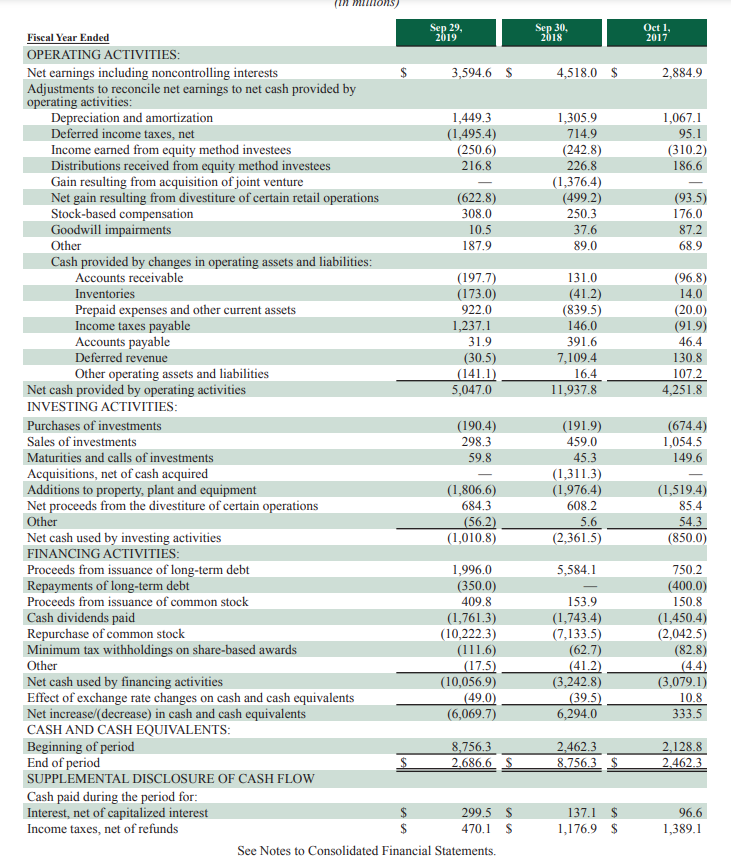
Market Value Ratios Amounts Answer Amounts Answer 2019 3,599.20 2018 4,518.30 Earnings per Share (EPS) Net Income No. shares outstanding Industry avg. not relevant Price/Earnings* Ratio (P/E) 51.69 Market Price EPS prior year not required * P/E ratio changes daily with market price. If EPS is negative, ratio is "not applicable". Use "Basic", not "Diluted". Sep 29, 2019 Sep 30, 2018 $ 2,686.6 $ 70.5 879.2 1,529.4 488.2 5,653.9 220.0 396.0 6,431.7 1,765.8 479.6 781.8 3,490.8 19,219.6 $ 8,756.3 181.5 693.1 1,400.5 1,462.8 12,494.2 267.7 334.7 5,929.1 134.7 412.2 1,042.2 3,541.6 24,156.4 S S ASSETS Current assets: Cash and cash equivalents Short-term investments Accounts receivable, net Inventories Prepaid expenses and other current assets Total current assets Long-term investments Equity investments Property, plant and equipment, net Deferred income taxes, net Other long-term assets Other intangible assets Goodwill TOTAL ASSETS LIABILITIES AND SHAREHOLDERS' EQUITY/(DEFICIT) Current liabilities: Accounts payable Accrued liabilities Accrued payroll and benefits Income taxes payable Stored value card liability and current portion of deferred revenue Current portion of long-term debt Total current liabilities Long-term debt Deferred revenue Other long-term liabilities Total liabilities Shareholders' equity/(deficit) Common stock ($0.001 par value) authorized, 2,400.0 shares; issued and outstanding, 1,184.6 and 1,309.1 shares, respectively Additional paid-in capital Retained earnings/(deficit) Accumulated other comprehensive loss Total shareholders' equity/(deficit) Noncontrolling interests Total equity/(deficit) TOTAL LIABILITIES AND SHAREHOLDERS' EQUITY/(DEFICIT) 1,189.7 1,753.7 664.6 1,291.7 1,269.0 1,179.3 1,752.5 656.8 102.8 1,642.9 349.9 5,684.2 9,090.2 6,775.7 1,430.5 22,980.6 6,168.7 11,167.0 6,744.4 1,370.5 25,450.6 1.3 1.2 41.1 (5,771.2) (503.3) (6,232.2) 1.2 (6,231.0) 19,219.6 $ 41.1 1,457.4 (330.3) 1,169.5 6.3 1,175.8 24,156.4 $ See Notes to Consolidated Financial Statements. STARBUCKS CORPORATION CONSOLIDATED STATEMENTS OF EARNINGS (in millions, except per share data) Sep 29, 2019 Sep 30, 2018 Oct 1, 2017 S Fiscal Year Ended Net revenues: Company-operated stores Licensed stores Other Total net revenues Cost of sales Store operating expenses Other operating expenses Depreciation and amortization expenses General and administrative expenses Restructuring and impairments Total operating expenses Income from equity investees Operating income Gain resulting from acquisition of joint venture Net gain resulting from divestiture of certain operations Interest income and other, net Interest expense Earnings before income taxes Income tax expense Net earnings including noncontrolling interests Net earnings/(loss) attributable to noncontrolling interests Net earnings attributable to Starbucks Earnings per share basic Earnings per share - diluted Weighted average shares outstanding: Basic Diluted 21,544.4 $ 2,875.0 2,089.2 26,508.6 8,526.9 10,493.6 371.0 1,377.3 1,824.1 135.8 22,728.7 298.0 4,077.9 19,690.3 $ 2,652.2 2,377.0 24,719.5 7,930.7 9,472.2 554.9 1,247.0 1,708.2 224.4 21,137.4 301.2 3,8833 1,376.4 499.2 191.4 (170.3) 5,780.0 1,262.0 4,518.0 (0.3) 4,518.3 $ 3.27 $ 3.24 $ 17,650.7 2,355.0 2,381.1 22,386.8 7,065.8 8,486.4 518.0 1,011.4 1,408.4 153.5 18,643.5 391.4 4,134.7 622.8 93.5 96.5 181.8 (331.0) 4,466.2 871.6 3,594.6 (4.6) 3,599.2 $ 2.95 $ 2.92 $ (92.5) 4,317.5 1,432.6 2,884.9 0.2 2,884.7 1.99 S S 1.97 1,22 1,233.2 82.7 1,394.6 1,449.5 1,461.5 See Notes to Consolidated Financial Statements. Sep 30, 2018 Oct 1, 2017 4,518,0 $ 2,884.9 1,067.1 95.1 (310.2) 186.6 1,305.9 714.9 (242.8) 226.8 (1,376.4) (499.2) 250.3 37.6 89.0 (93.5) 176.0 87.2 68.9 131.0 (41.2) (839.5) 146.0 391.6 7,109.4 16.4 11,937.8 (96.8) 14.0 (20.0) (91.9) 46.4 130.8 107.2 4,251.8 Sep 29, Fiscal Year Ended 2019 OPERATING ACTIVITIES: Net earnings including noncontrolling interests 3,594.6 $ Adjustments to reconcile net earnings to net cash provided by operating activities: Depreciation and amortization 1,449.3 Deferred income taxes, net (1,495.4) Income earned from equity method investees (250.6) Distributions received from equity method investees 216.8 Gain resulting from acquisition of joint venture Net gain resulting from divestiture of certain retail operations (622.8) Stock-based compensation 308.0 Goodwill impairments 10.5 Other 187.9 Cash provided by changes in operating assets and liabilities: Accounts receivable (197.7) Inventories (173.0) Prepaid expenses and other current assets 922.0 Income taxes payable 1,237.1 Accounts payable 31.9 Deferred revenue (30.5) Other operating assets and liabilities (141.1) Net cash provided by operating activities 5,047.0 INVESTING ACTIVITIES: Purchases of investments (190.4) Sales of investments 298.3 Maturities and calls of investments 59.8 Acquisitions, net of cash acquired Additions to property, plant and equipment (1,806.6) Net proceeds from the divestiture of certain operations 684.3 Other (56.2) Net cash used by investing activities (1,010.8) FINANCING ACTIVITIES: Proceeds from issuance of long-term debt 1,996.0 Repayments of long-term debt (350.0) Proceeds from issuance of common stock 409.8 Cash dividends paid (1,761.3) Repurchase of common stock (10,222.3) Minimum tax withholdings on share-based awards (1116) Other (17.5) Net cash used by financing activities (10,056.9) Effect of exchange rate changes on cash and cash equivalents (49.0) Net increase/(decrease) in cash and cash equivalents (6,069.7) CASH AND CASH EQUIVALENTS: Beginning of period 8,756.3 End of period 2,686.6 S SUPPLEMENTAL DISCLOSURE OF CASH FLOW Cash paid during the period for: Interest, net of capitalized interest 299.5 S Income taxes, net of refunds 470.1 S See Notes to Consolidated Financial Statements. (674.4) 1,054.5 149.6 (191.9) 459.0 45.3 (1,311.3) (1,976.4) 608.2 5.6 (2,361.5) (1,519.4) 85.4 54.3 (850.0) 5,584.1 750.2 (400.0) 150.8 (1,450.4) (2,042.5) (82.8) 153.9 (1,743.4) (7,133.5) (62.7) (41.2) (3,242.8) (39.5) 6,294.0 (3,079.1) 10.8 333.5 2.462.3 8.756.3 S 2,128.8 2.462.3 137.1 1,176.9 $ 96.6 1,389.1