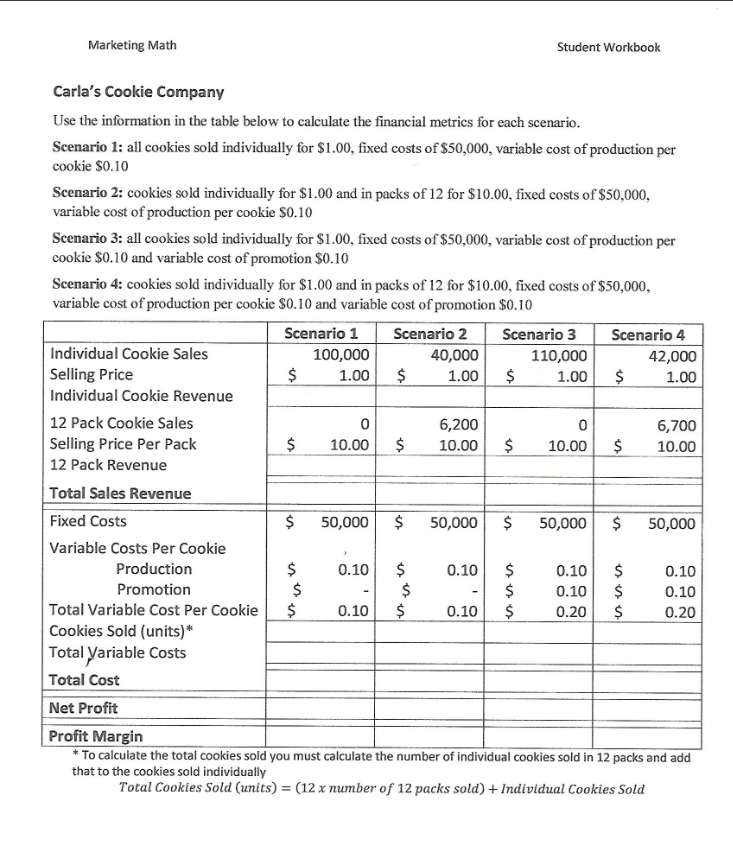
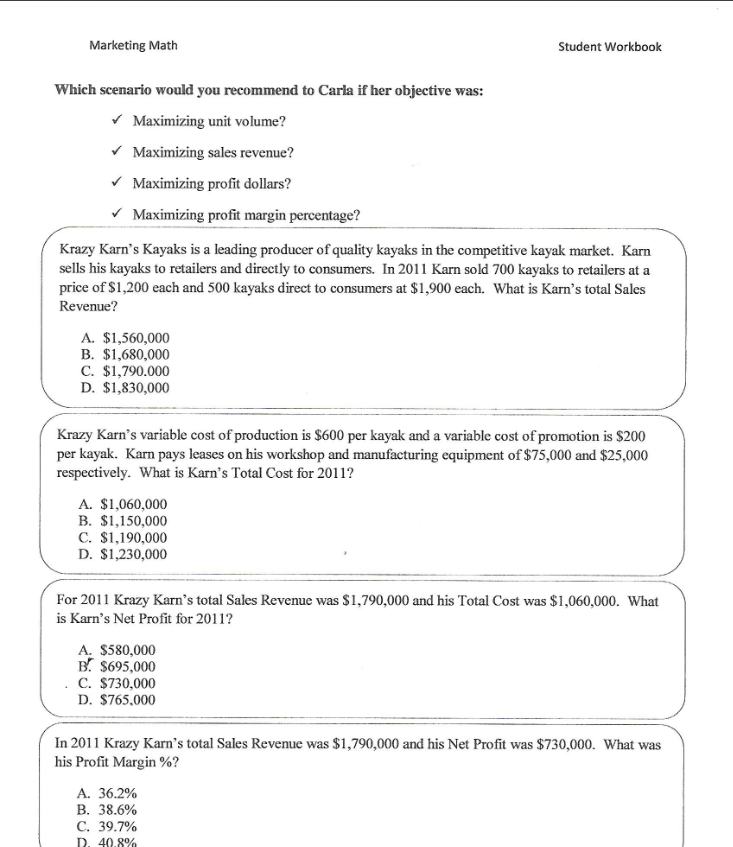
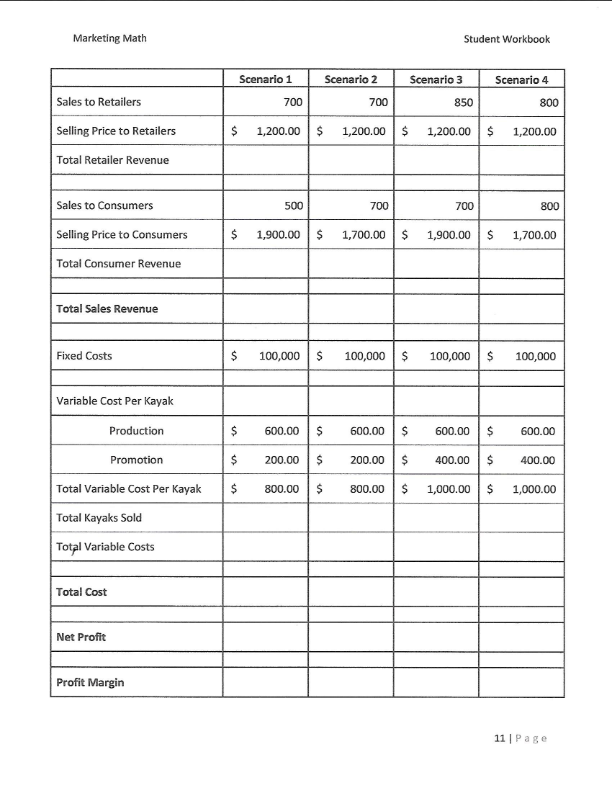
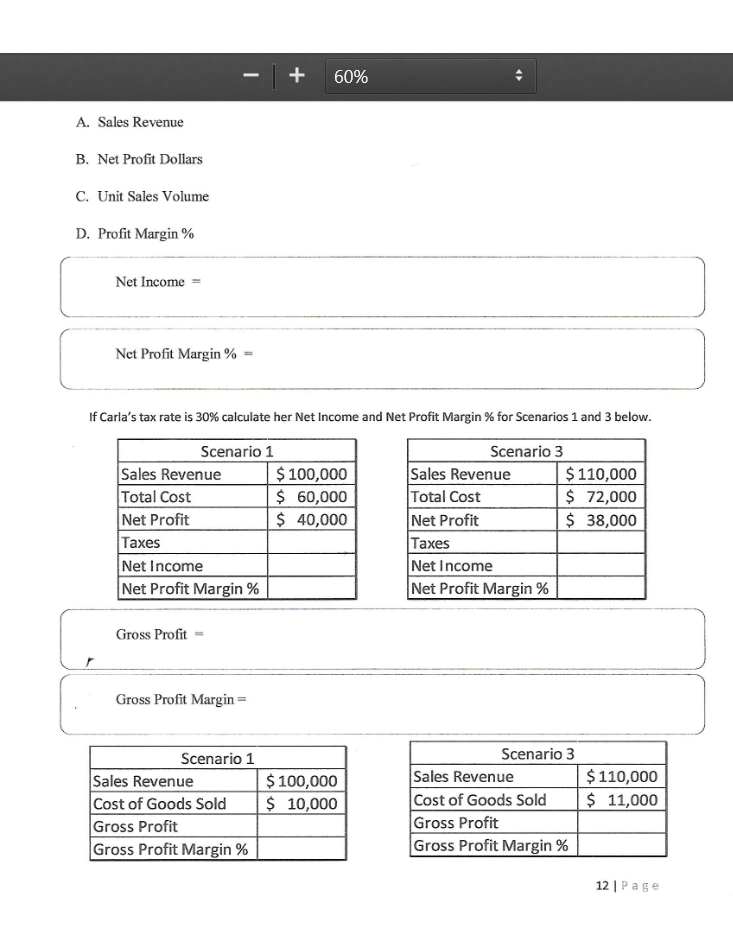
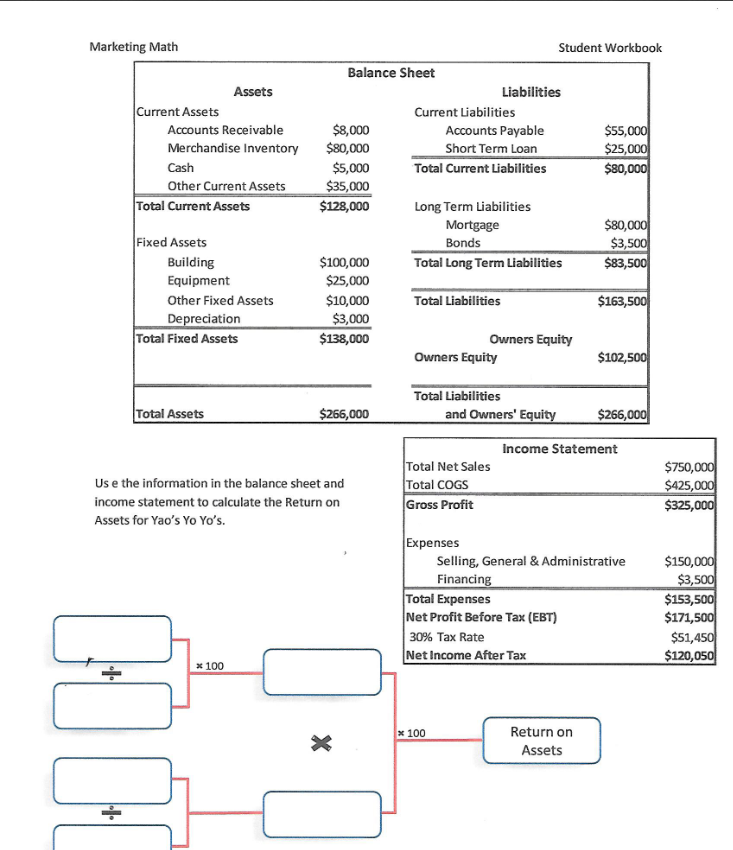
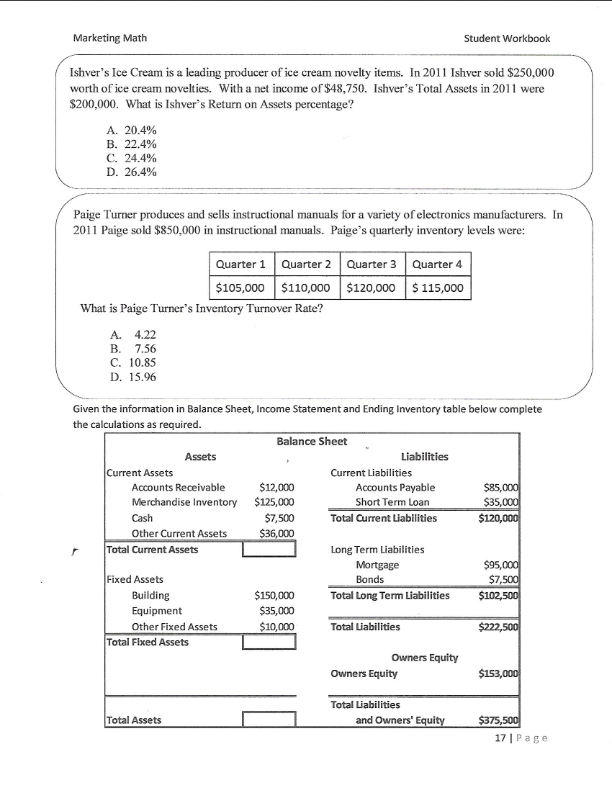
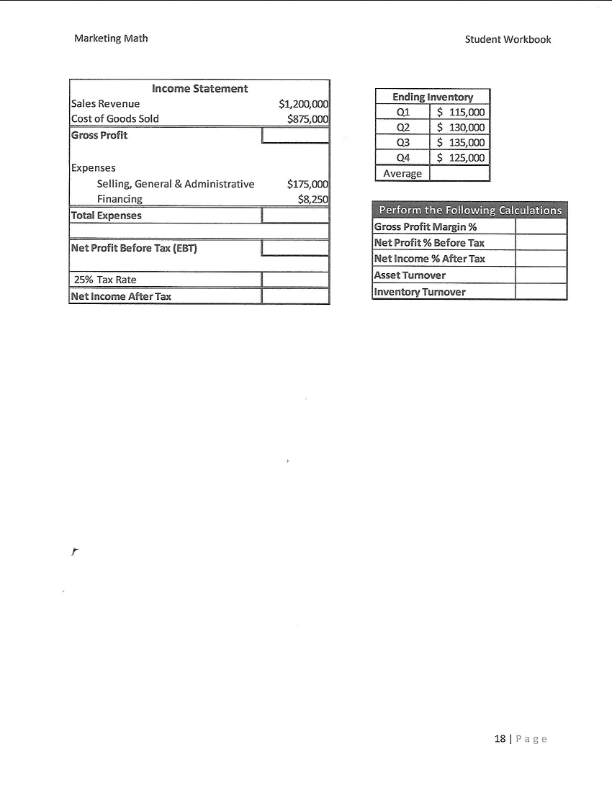
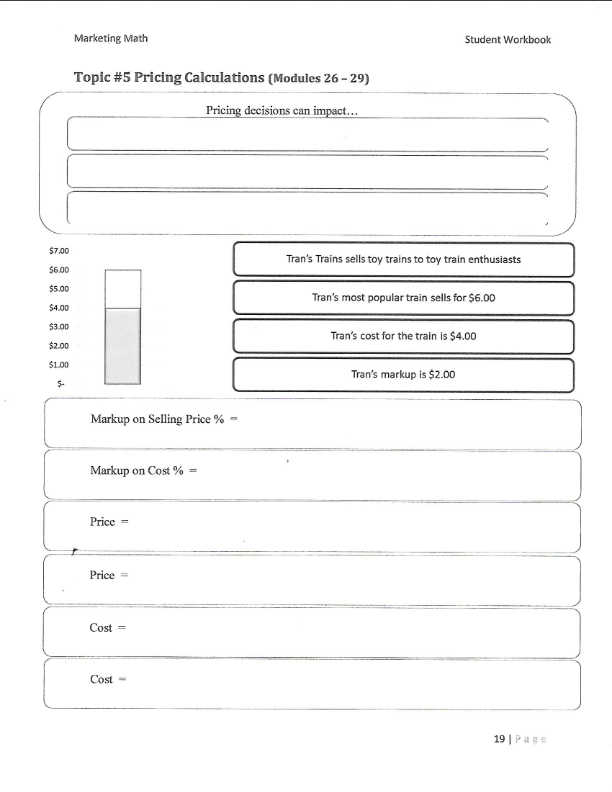
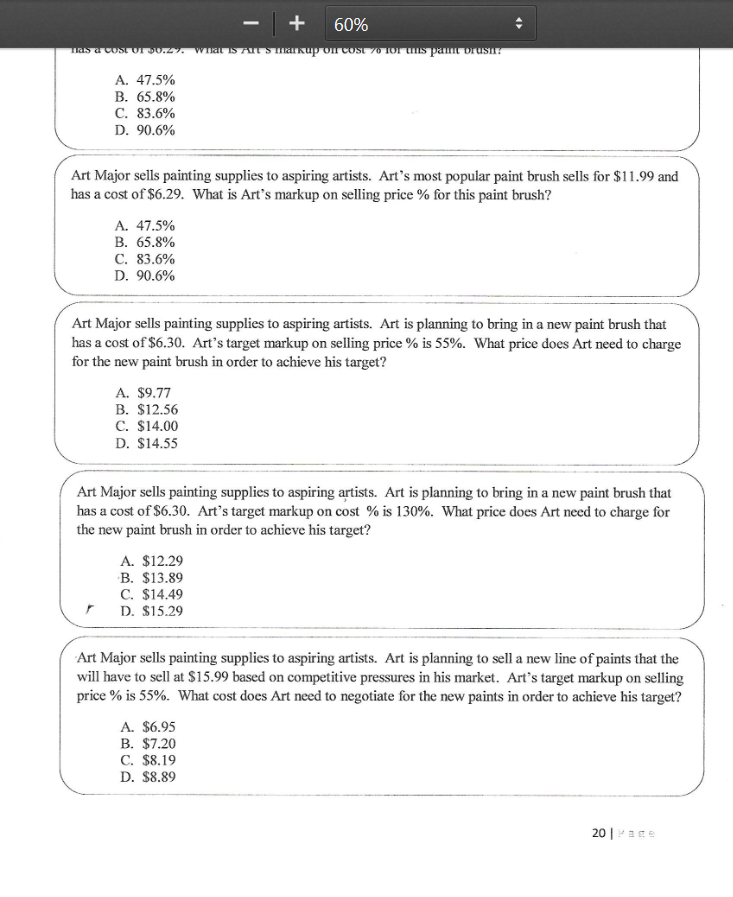
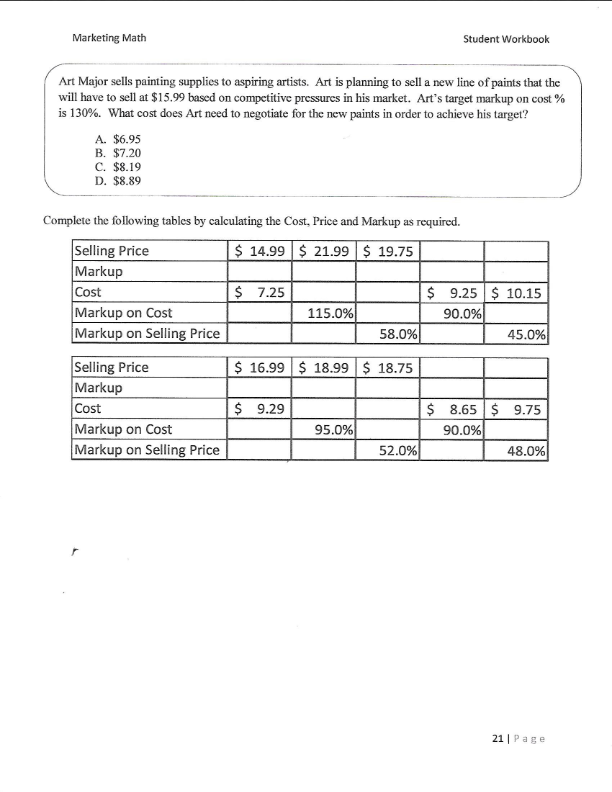
Marketing Math Student Workbook Carla's Cookie Company Use the information in the table below to calculate the financial metrics for each scenario. Scenario 1: all cookies sold individually for $1.00, fixed costs of $50,000, variable cost of production per cookie $0.10 Scenario 2: cookies sold individually for $1.00 and in packs of 12 for $10.00, fixed costs of $50,000, variable cost of production per cookie $0.10 Scenario 3: all cookies sold individually for $1.00, fixed costs of $50,000, variable cost of production per cookie $0.10 and variable cost of promotion $0.10 Scenario 4: cookies sold individually for $1.00 and in packs of 12 for $10.00, fixed costs of $50,000, variable cost of production per cookie $0.10 and variable cost of promotion $0.10 Scenario 1 Scenario 2 Scenario 3 Scenario 4 Individual Cookie Sales 100,000 40,000 110,000 42,000 Selling Price $ 1.00 $ 1.00 $ 1.00 $ 1.00 Individual Cookie Revenue 12 Pack Cookie Sales 0 6,200 0 6,700 Selling Price Per Pack $ 10.00 $ 10.00 $ 10.00 10.00 12 Pack Revenue Total Sales Revenue Fixed Costs $ 50,000 $ 50,000 $ 50,000 $ 50,000 Variable Costs Per Cookie Production $ 0.10 $ 0.10 $ 0.10 $ 0.10 Promotion $ $ $ 0.10 $ 0.10 Total Variable Cost Per Cookie $ 0.10 $ 0.10 $ 0.20 $ 0.20 Cookies Sold (units)* Total Variable costs Total Cost Net Profit Profit Margin * To calculate the total cookies sold you must calculate the number of individual cookies sold in 12 packs and add that to the cookies sold individually Total Cookies Sold (units) = (12 x number of 12 packs sold) + Individual Cookies Sold $ Marketing Math Student Workbook Which scenario would you recommend to Carla if her objective was: Maximizing unit volume? Maximizing sales revenue? Maximizing profit dollars? Maximizing profit margin percentage? Krazy Karn's Kayaks is a leading producer of quality kayaks in the competitive kayak market. Karn sells his kayaks to retailers and directly to consumers. In 2011 Karn sold 700 kayaks to retailers at a price of $1,200 each and 500 kayaks direct to consumers at $1,900 each. What is Karn's total Sales Revenue? A. $1,560,000 B. $1,680,000 C. $1,790.000 D. $1,830,000 Krazy Karn's variable cost of production is $600 per kayak and a variable cost of promotion is $200 per kayak. Karn pays leases on his workshop and manufacturing equipment of $75,000 and $25,000 respectively. What is Karn's Total Cost for 2011? A. $1,060,000 B. $1,150,000 C. $1,190,000 D. $1,230,000 For 2011 Krazy Karn's total Sales Revenue was $1,790,000 and his Total Cost was $1,060,000. What is Karn's Net Profit for 2011? A. $580,000 B! $695,000 C. $730,000 D. $765,000 In 2011 Krazy Karn's total Sales Revenue was $1,790,000 and his Net Profit was $730,000. What was his Profit Margin %? A. 36.2% B. 38.6% C. 39.7% D. 40.8% Marketing Math Student Workbook Scenario 2 Scenario 3 Scenario 4 Scenario 1 700 Sales to Retailers 700 850 800 $ 1,200.00 $ 1,200.00 $ 1,200.00 $ 1,200.00 Selling Price to Retailers Total Retailer Revenue 500 700 700 800 Sales to Consumers Selling Price to Consumers 1,900.00 $ 1,700.00 $ 1,900.00 $ 1,700.00 Total Consumer Revenue Total Sales Revenue Fixed Costs $ $ 100,000 $ 100,000 $ 100,000 $ 100,000 Variable Cost Per Kayak Production 600.00 $ 600.00 $ 600.00 $ 600.00 200.00 $ 200.00 $ 400.00 $ 400.00 800.00 $ 800.00 $ 1,000.00 $ 1,000.00 Promotion Total Variable Cost Per Kayak Total Kayaks Sold Total Variable Costs Total Cost Net Profit Profit Margin 11 Page + 60% A. Sales Revenue B. Net Profit Dollars C. Unit Sales Volume D. Profit Margin % Net Income Net Profit Margin% If Carla's tax rate is 30% calculate her Net Income and Net Profit Margin % for Scenarios 1 and 3 below. Scenario 1 Scenario 3 Sales Revenue $ 100,000 Sales Revenue $ 110,000 Total Cost $ 60,000 Total Cost $ 72,000 Net Profit $ 40,000 Net Profit $ 38,000 Taxes Taxes Net Income Net Income Net Profit Margin % Net Profit Margin % Gross Profit Gross Profit Margin= Scenario 1 Sales Revenue Cost of Goods Sold Gross Profit Gross Profit Margin % $ 100,000 $ 10,000 Scenario 3 Sales Revenue Cost of Goods Sold Gross Profit Gross Profit Margin % $ 110,000 $ 11,000 12 Page Marketing Math Assets Current Assets Accounts Receivable Merchandise Inventory Cash Other Current Assets Total Current Assets Student Workbook Balance Sheet Liabilities Current Liabilities $8,000 Accounts Payable $55,000 $80,000 Short Term Loan $25,000 $5,000 Total Current Liabilities $80,000 $35,000 $128,000 Long Term Liabilities Mortgage $80,000 Bonds $3,500 $100,000 Total Long Term Liabilities $83,500 $25,000 $10,000 Total Liabilities $163,500 $3,000 $138,000 Owners Equity Owners Equity $102,500 Fixed Assets Building Equipment Other Fixed Assets Depreciation Total Fixed Assets Total Assets $266,000 Total Liabilities and Owners' Equity $266,000 Income Statement Us e the information in the balance sheet and income statement to calculate the Return on Assets for Yao's Yo Yo's. Total Net Sales Total COGS Gross Profit $750,000 $425,000 $325,000 Expenses Selling, General & Administrative Financing Total Expenses Net Profit Before Tax (EBT) 30% Tax Rate Net Income After Tax $150,000 $3,500 $153,500 $171,500 $51,450 $120,050 * 100 * 100 X Return on Assets Marketing Math Student Workbook Ishver's Ice Cream is a leading producer of ice cream novelty items. In 2011 Ishver sold $250,000 worth of ice cream novelties. With a net income of $48,750. Ishver's Total Assets in 2011 were $200,000. What is Ishver's Return on Assets percentage? A. 20.4% B. 22.4% C. 24.4% D. 26.4% Paige Turner produces and sells instructional manuals for a variety of electronics manufacturers. In 2011 Paige sold $850,000 in instructional manuals. Paige's quarterly inventory levels were: Quarter 1 Quarter 2 Quarter 3 Quarter 4 $105,000 $110,000 $120,000 $ 115,000 What is Paige Turner's Inventory Turnover Rate? A. 4.22 B. 7.56 C. 10.85 D. 15.96 Given the information in Balance Sheet, Income Statement and Ending Inventory table below complete the calculations as required. Balance Sheet Assets Liabilities Current Assets Current Liabilities Accounts Receivable $12,000 Accounts Payable $85,000 Merchandise Inventory $125,000 Short Term Loan $35,000 Cash $7,500 Total Current Liabilities $120,000 Other Current Assets $36,000 Total Current Assets Long Term Liabilities Mortgage $95,000 Fixed Assets Bonds $7,500 Building $150,000 Total Long Term Liabilities $102,500 Equipment $35,000 Other Fixed Assets $10,000 Total Liabilities $222,500 Total Fixed Assets Owners Equity Owners Equity $153,000 Total Assets Total Liabilities and Owners' Equity $375,500 17 Page Marketing Math Student Workbook Income Statement Sales Revenue Cost of Goods Sold Gross Profit $1,200,000 $875,000 Q1 Ending Inventory $ 115,000 Q2 $ 130,000 03 $ 135,000 04 $ 125,000 Average Expenses Selling, General & Administrative Financing Total Expenses $175,000 $8,250 Net Profit Before Tax (EBT) Perform the following Calculations Gross Profit Margin % Net Profit % Before Tax Net Income % After Tax Asset Turnover Inventory Turnover 25% Tax Rate Net Income After Tax 18 Page Marketing Math Student Workbook Topic #5 Pricing Calculations (Modules 26-29) Pricing decisions can impact... $7.00 Tran's Trains sells toy trains to toy train enthusiasts $6.00 $5.00 Tran's most popular train sells for $6.00 $4.00 $3.00 Tran's cost for the train is $4.00 $2.00 $1.00 Tran's markup is $2.00 5- Markup on Selling Price % - Markup on Cost % = Price - Price Cost - Cost 19 Pat + 60% TIST CUSTOIDU.27. What Is A SmalkuponcoSL 70 Tor US paint brush A. 47.5% B. 65.8% C. 83.6% D. 90.6% Art Major sells painting supplies to aspiring artists. Art's most popular paint brush sells for $11.99 and has a cost of $6.29. What is Art's markup on selling price % for this paint brush? A. 47.5% B. 65.8% C. 83.6% D. 90.6% Art Major sells painting supplies to aspiring artists. Art is planning to bring in a new paint brush that has a cost of $6.30. Art's target markup on selling price % is 55%. What price does Art need to charge for the new paint brush in order to achieve his target? A. $9.77 B. $12.56 C. $14.00 D. $14.55 Art Major sells painting supplies to aspiring artists. Art is planning to bring in a new paint brush that has a cost of $6.30. Art's target markup on cost % is 130%. What price does Art need to charge for the new paint brush in order to achieve his target? A. $12.29 B. $13.89 C. $14.49 D. $15.29 Art Major sells painting supplies to aspiring artists. Art is planning to sell a new line of paints that the will have to sell at $15.99 based on competitive pressures in his market. Art's target markup on selling price % is 55%. What cost does Art need to negotiate for the new paints in order to achieve his target? A. $6.95 B. $7.20 C. $8.19 D. $8.89 20ace Marketing Math Student Workbook Art Major sells painting supplies to aspiring artists. Art is planning to sell a new line of paints that the will have to sell at $15.99 based on competitive pressures in his market. Art's target markup on cost % is 130%. What cost does Art need to negotiate for the new paints in order to achieve his target? A. $6.95 B. $7.20 C. $8.19 D. $8.89 Complete the following tables by calculating the Cost, Price and Markup as required. Selling Price $ 14.99 $ 21.99 $ 19.75 Markup Cost $ 7.25 $ 9.25 $ 10.15 Markup on Cost 115.0% 90.0% Markup on Selling Price 58.0% 45.0% Selling Price $ 16.99 $ 18.99 $ 18.75 Markup Cost $9.29 $ 8.65 $ 9.75 Markup on Cost 95.0% 90.0% Markup on Selling Price 52.0% 48.0% 21 Page


