Marketing Simulation: Managing Segments and Customers V3
follow the link
http://academic.hbsp.harvard.edu/marketing-segments-customers
do step 6-13
from the analyze
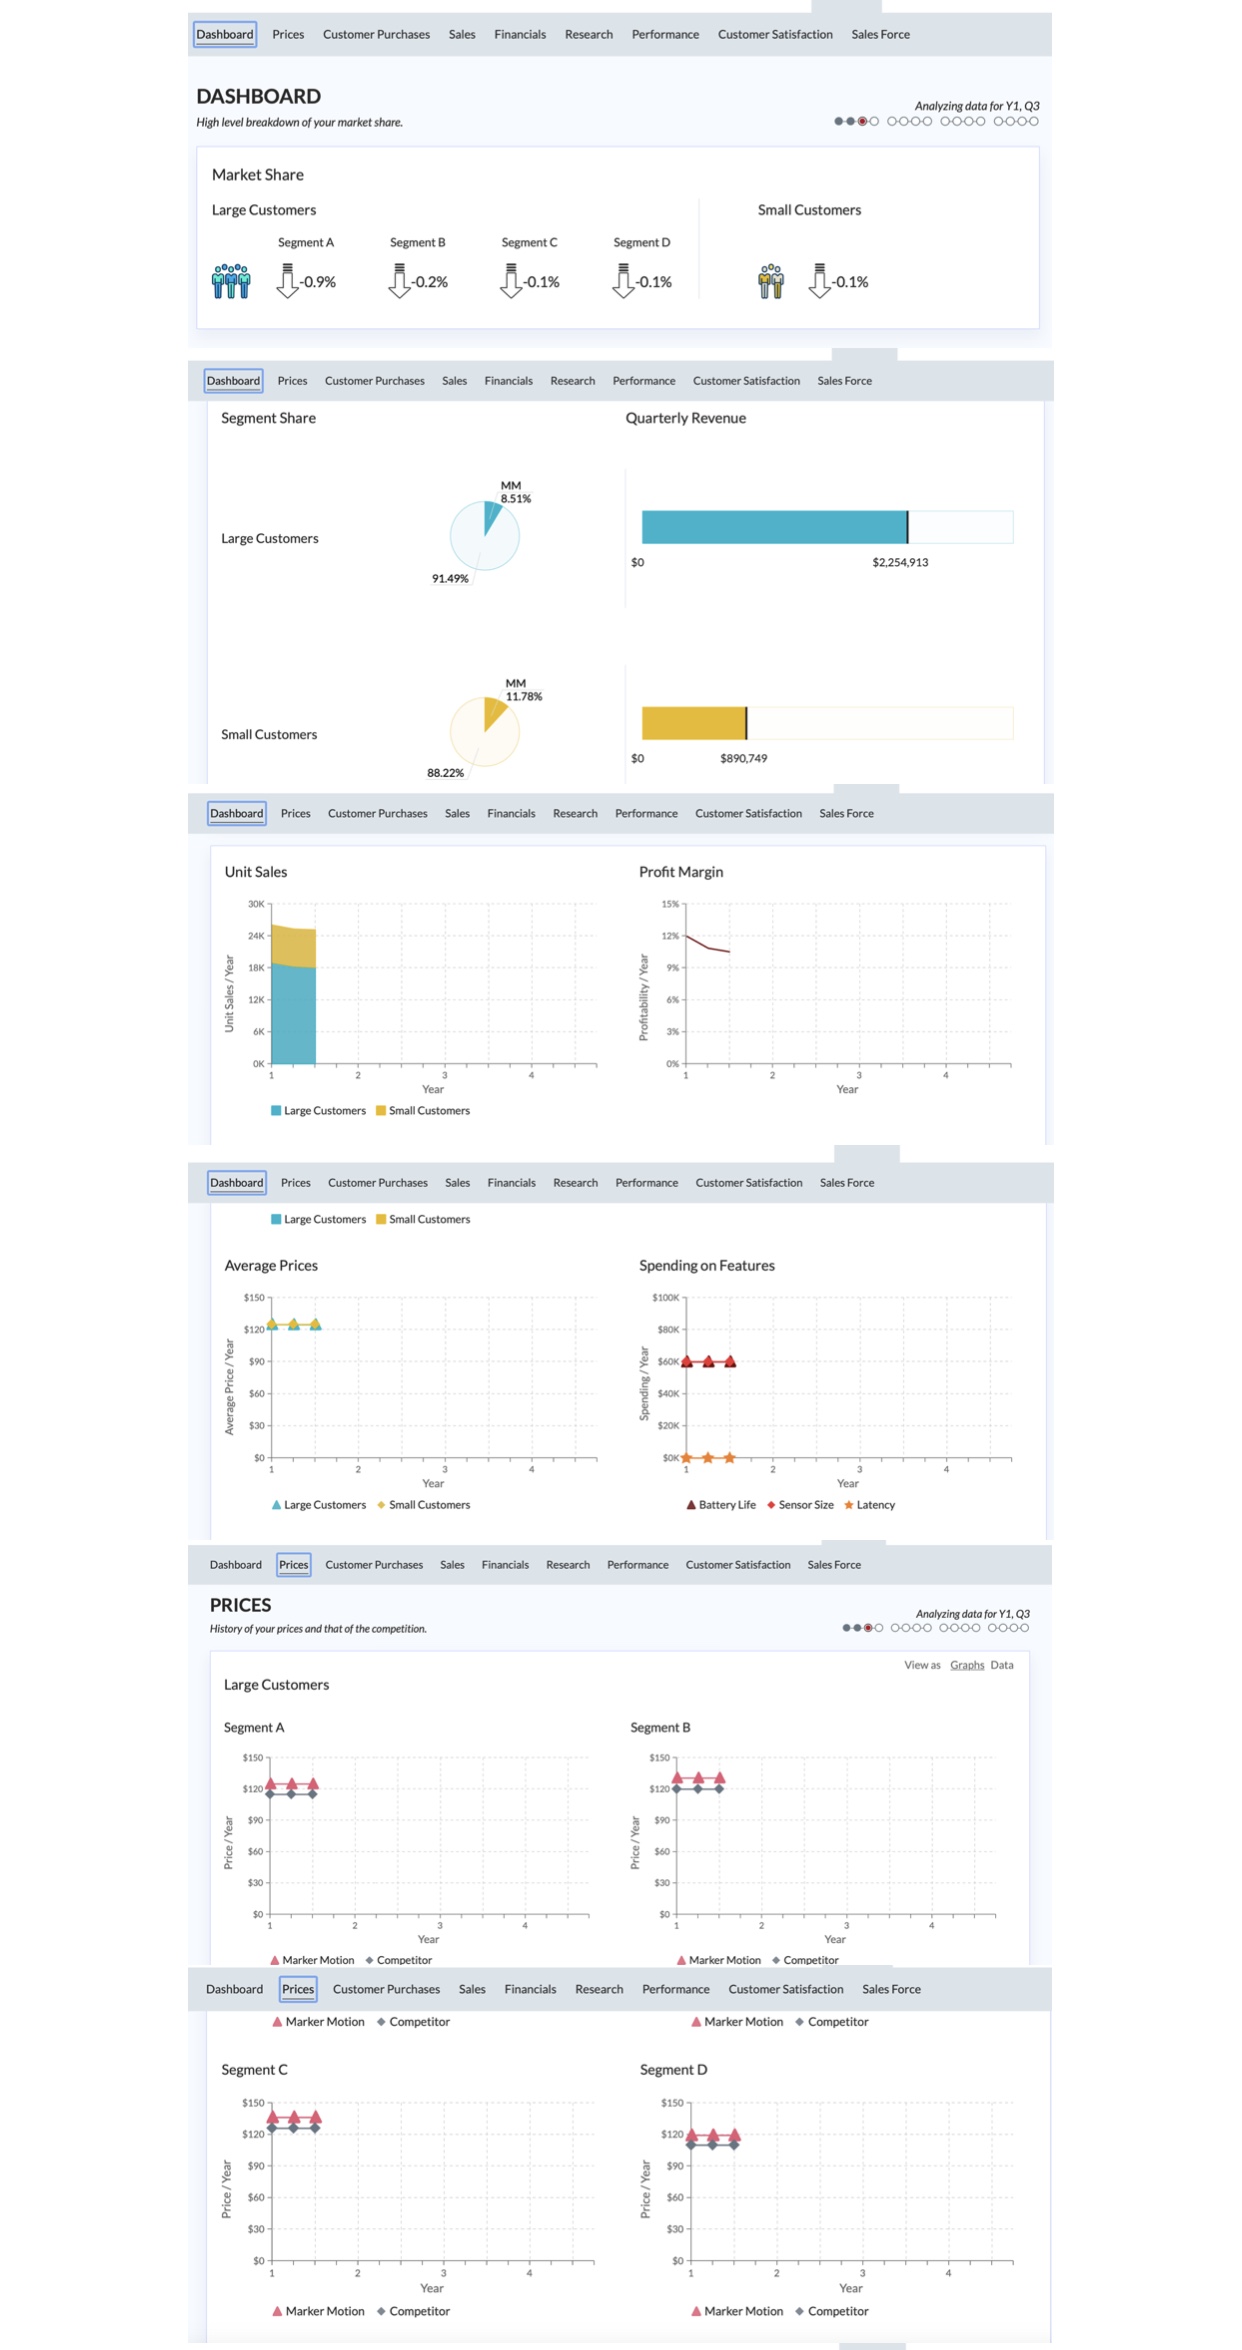
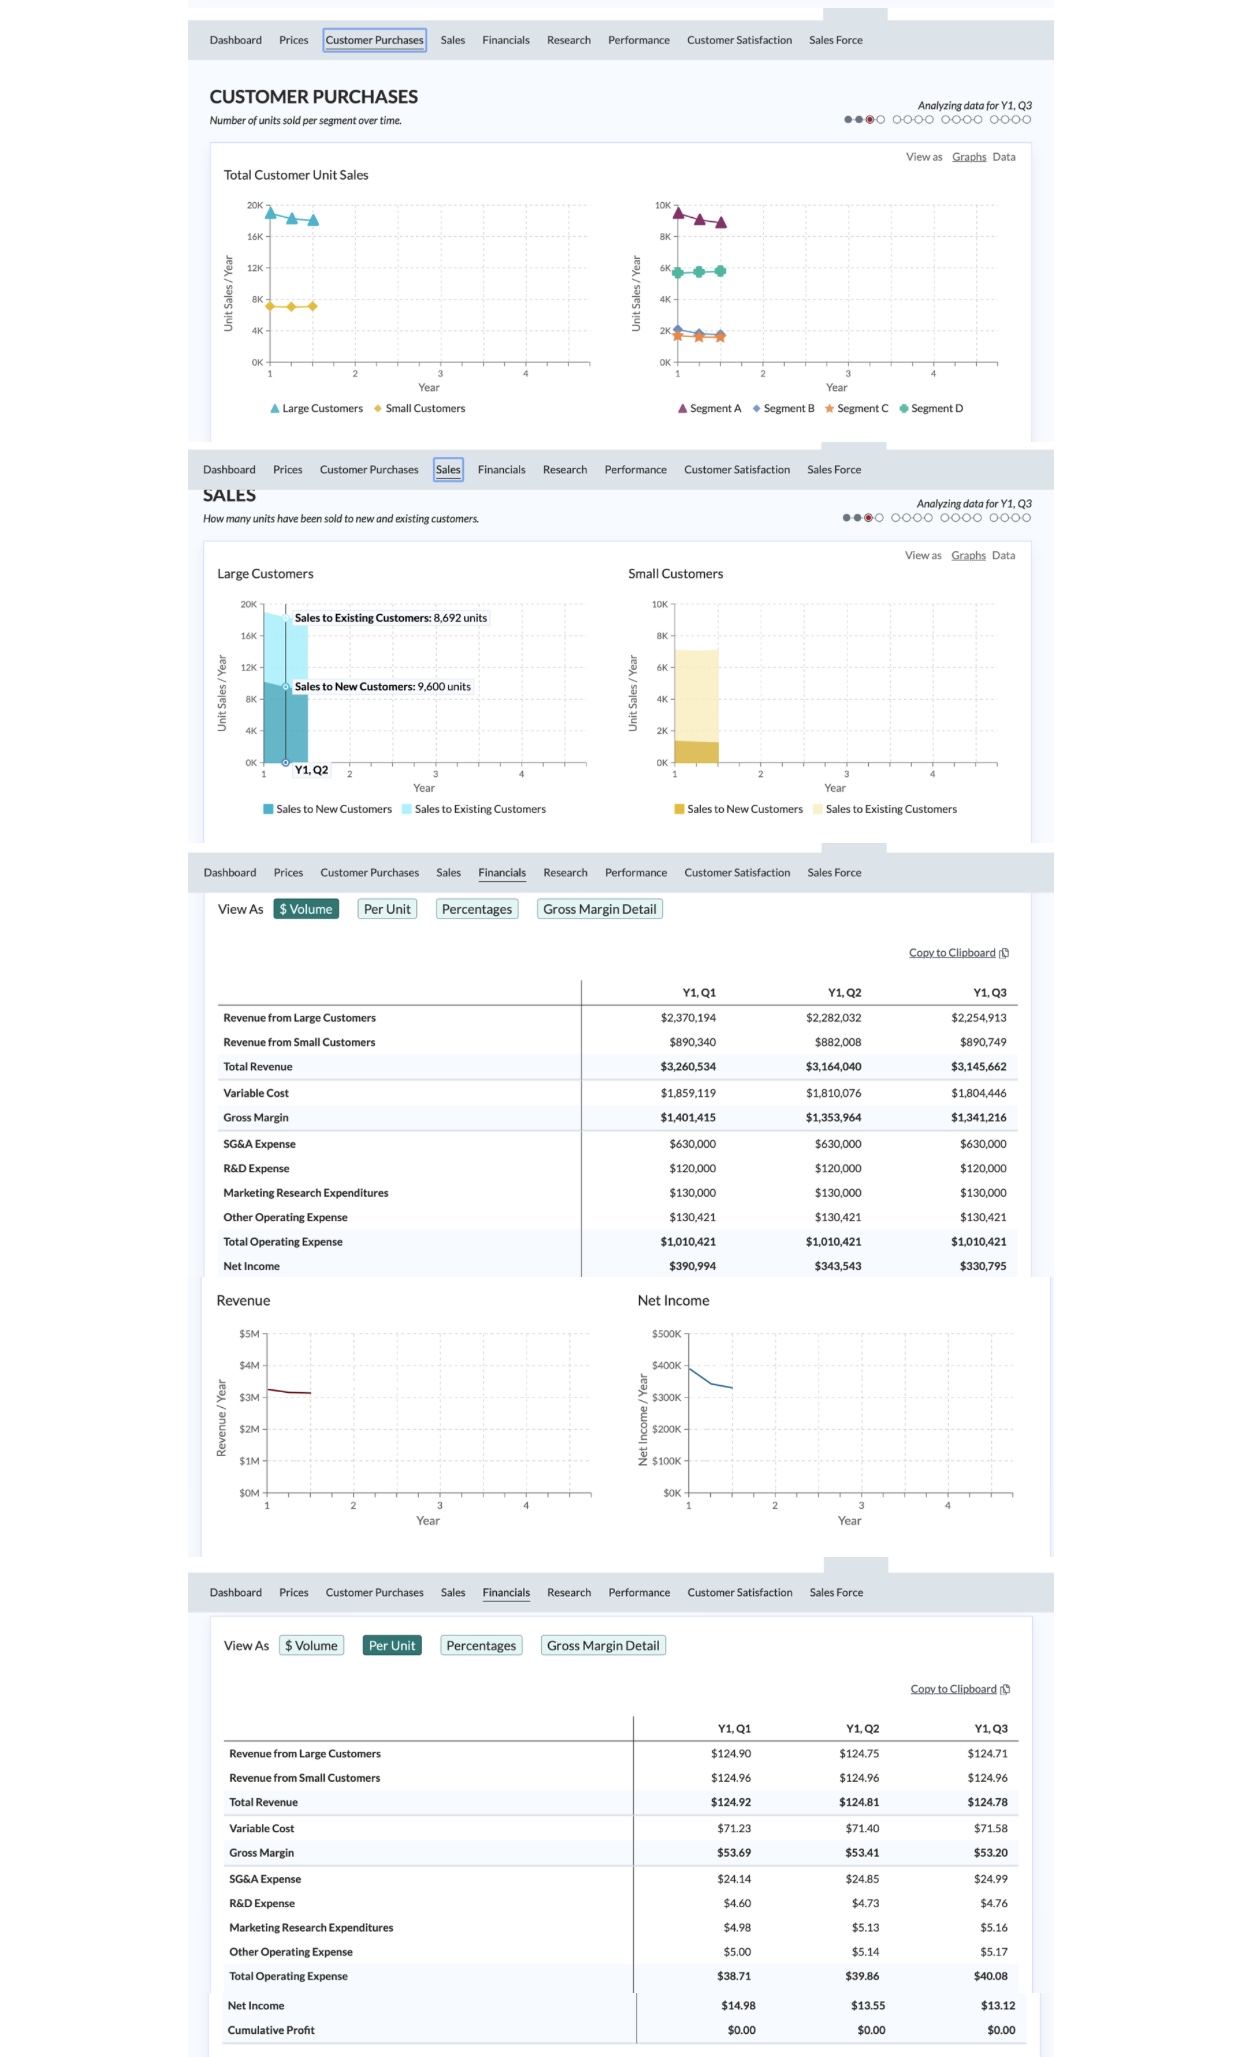
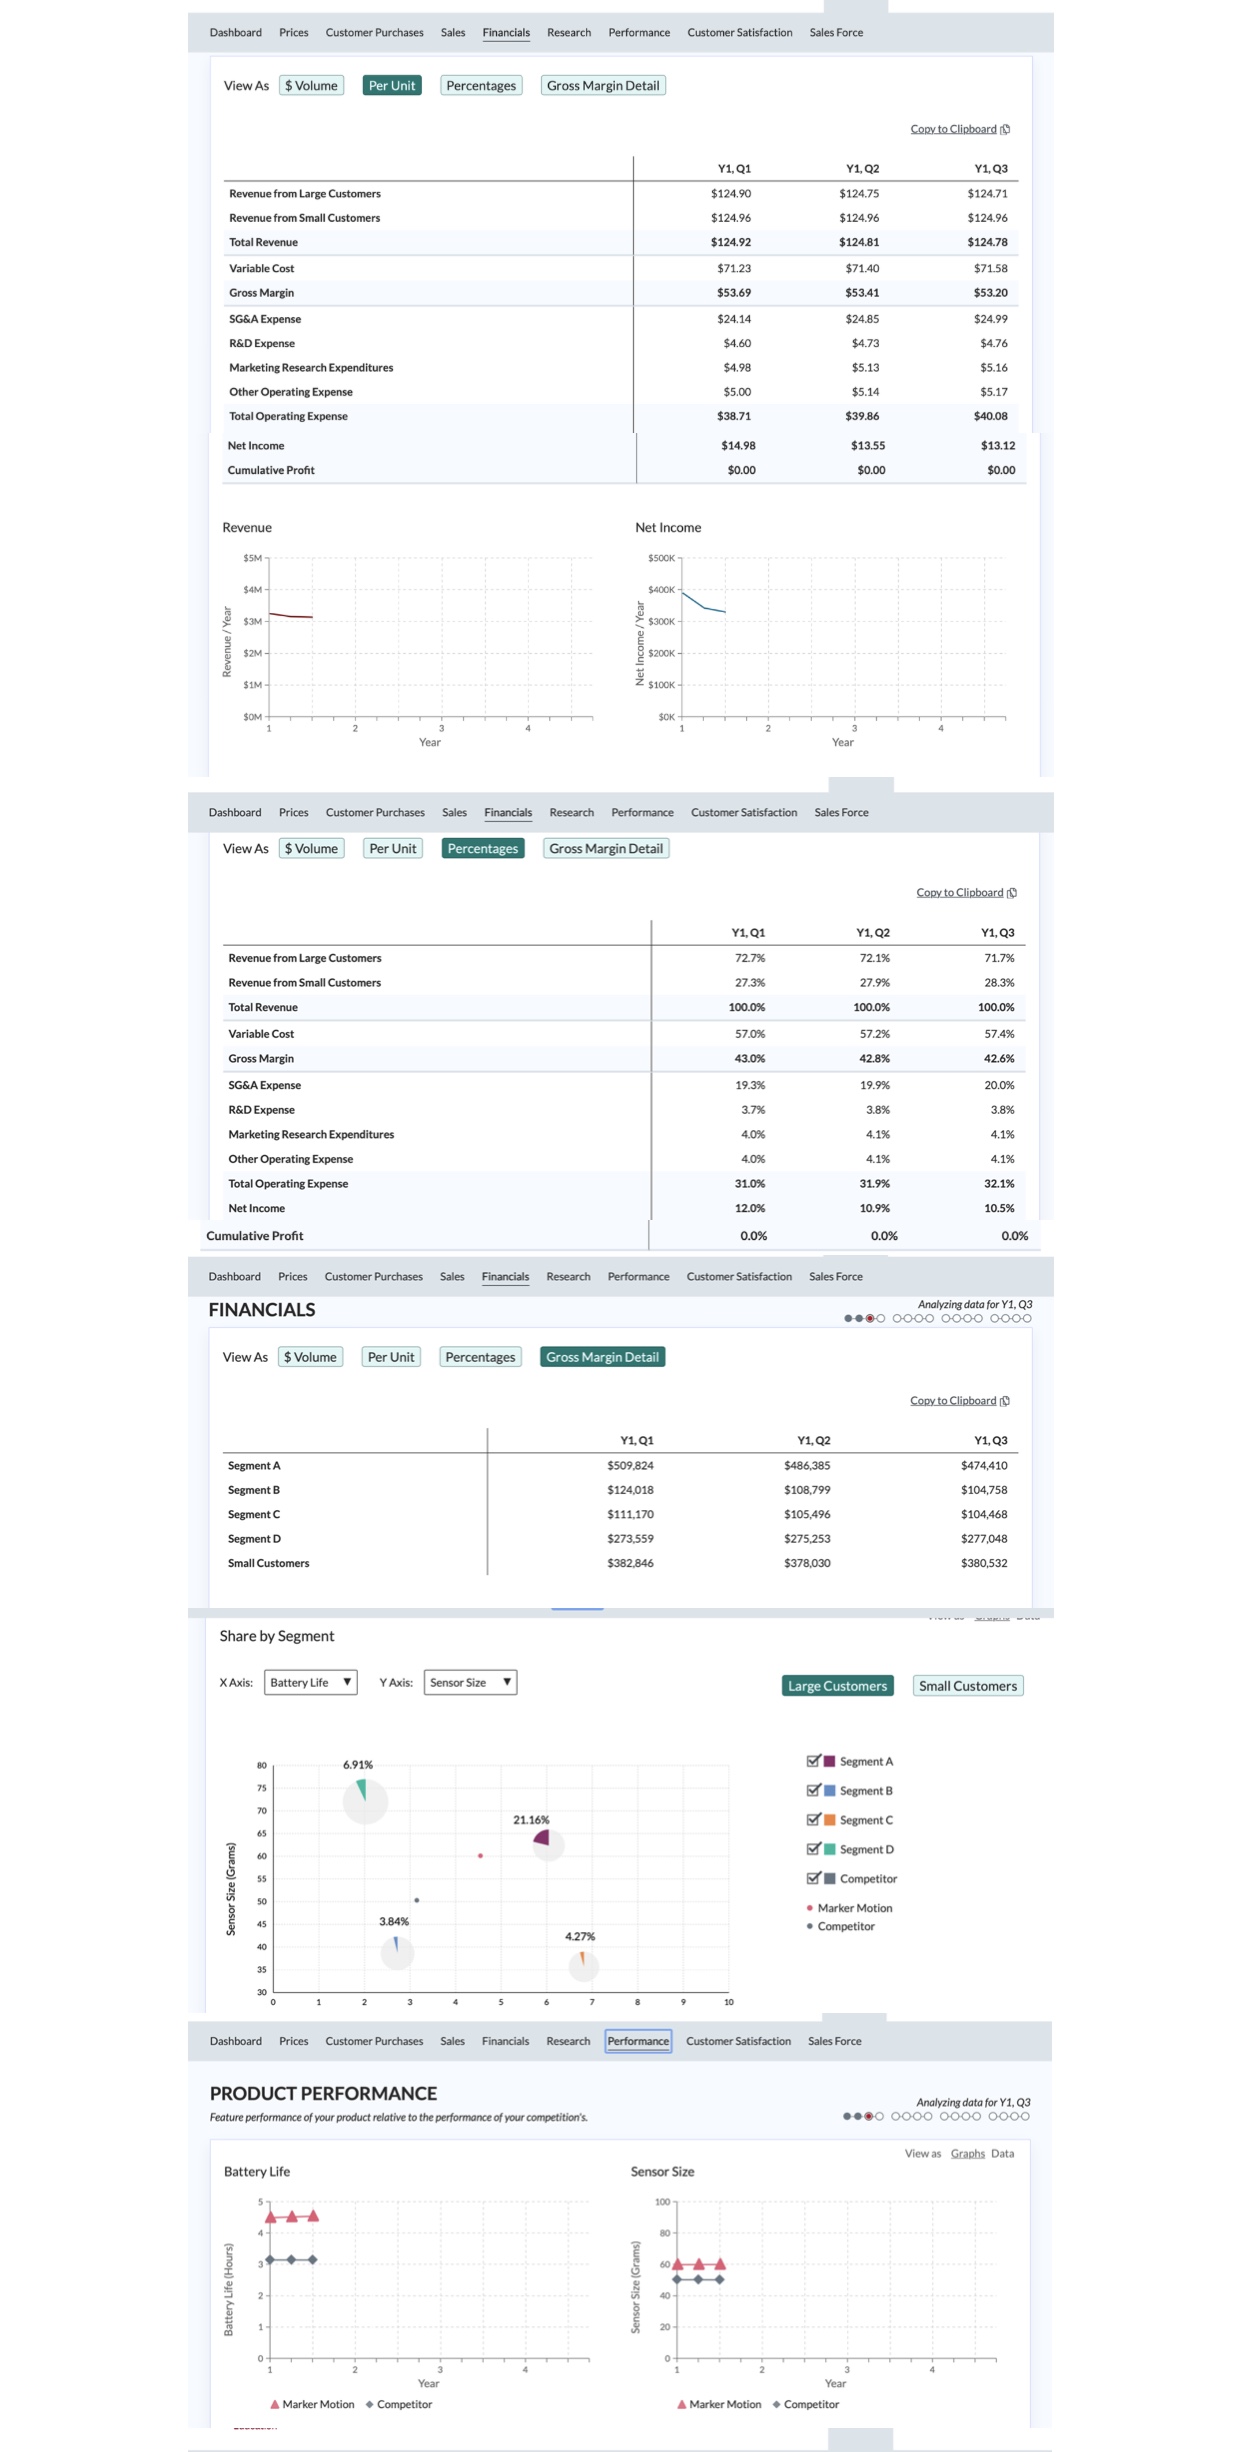
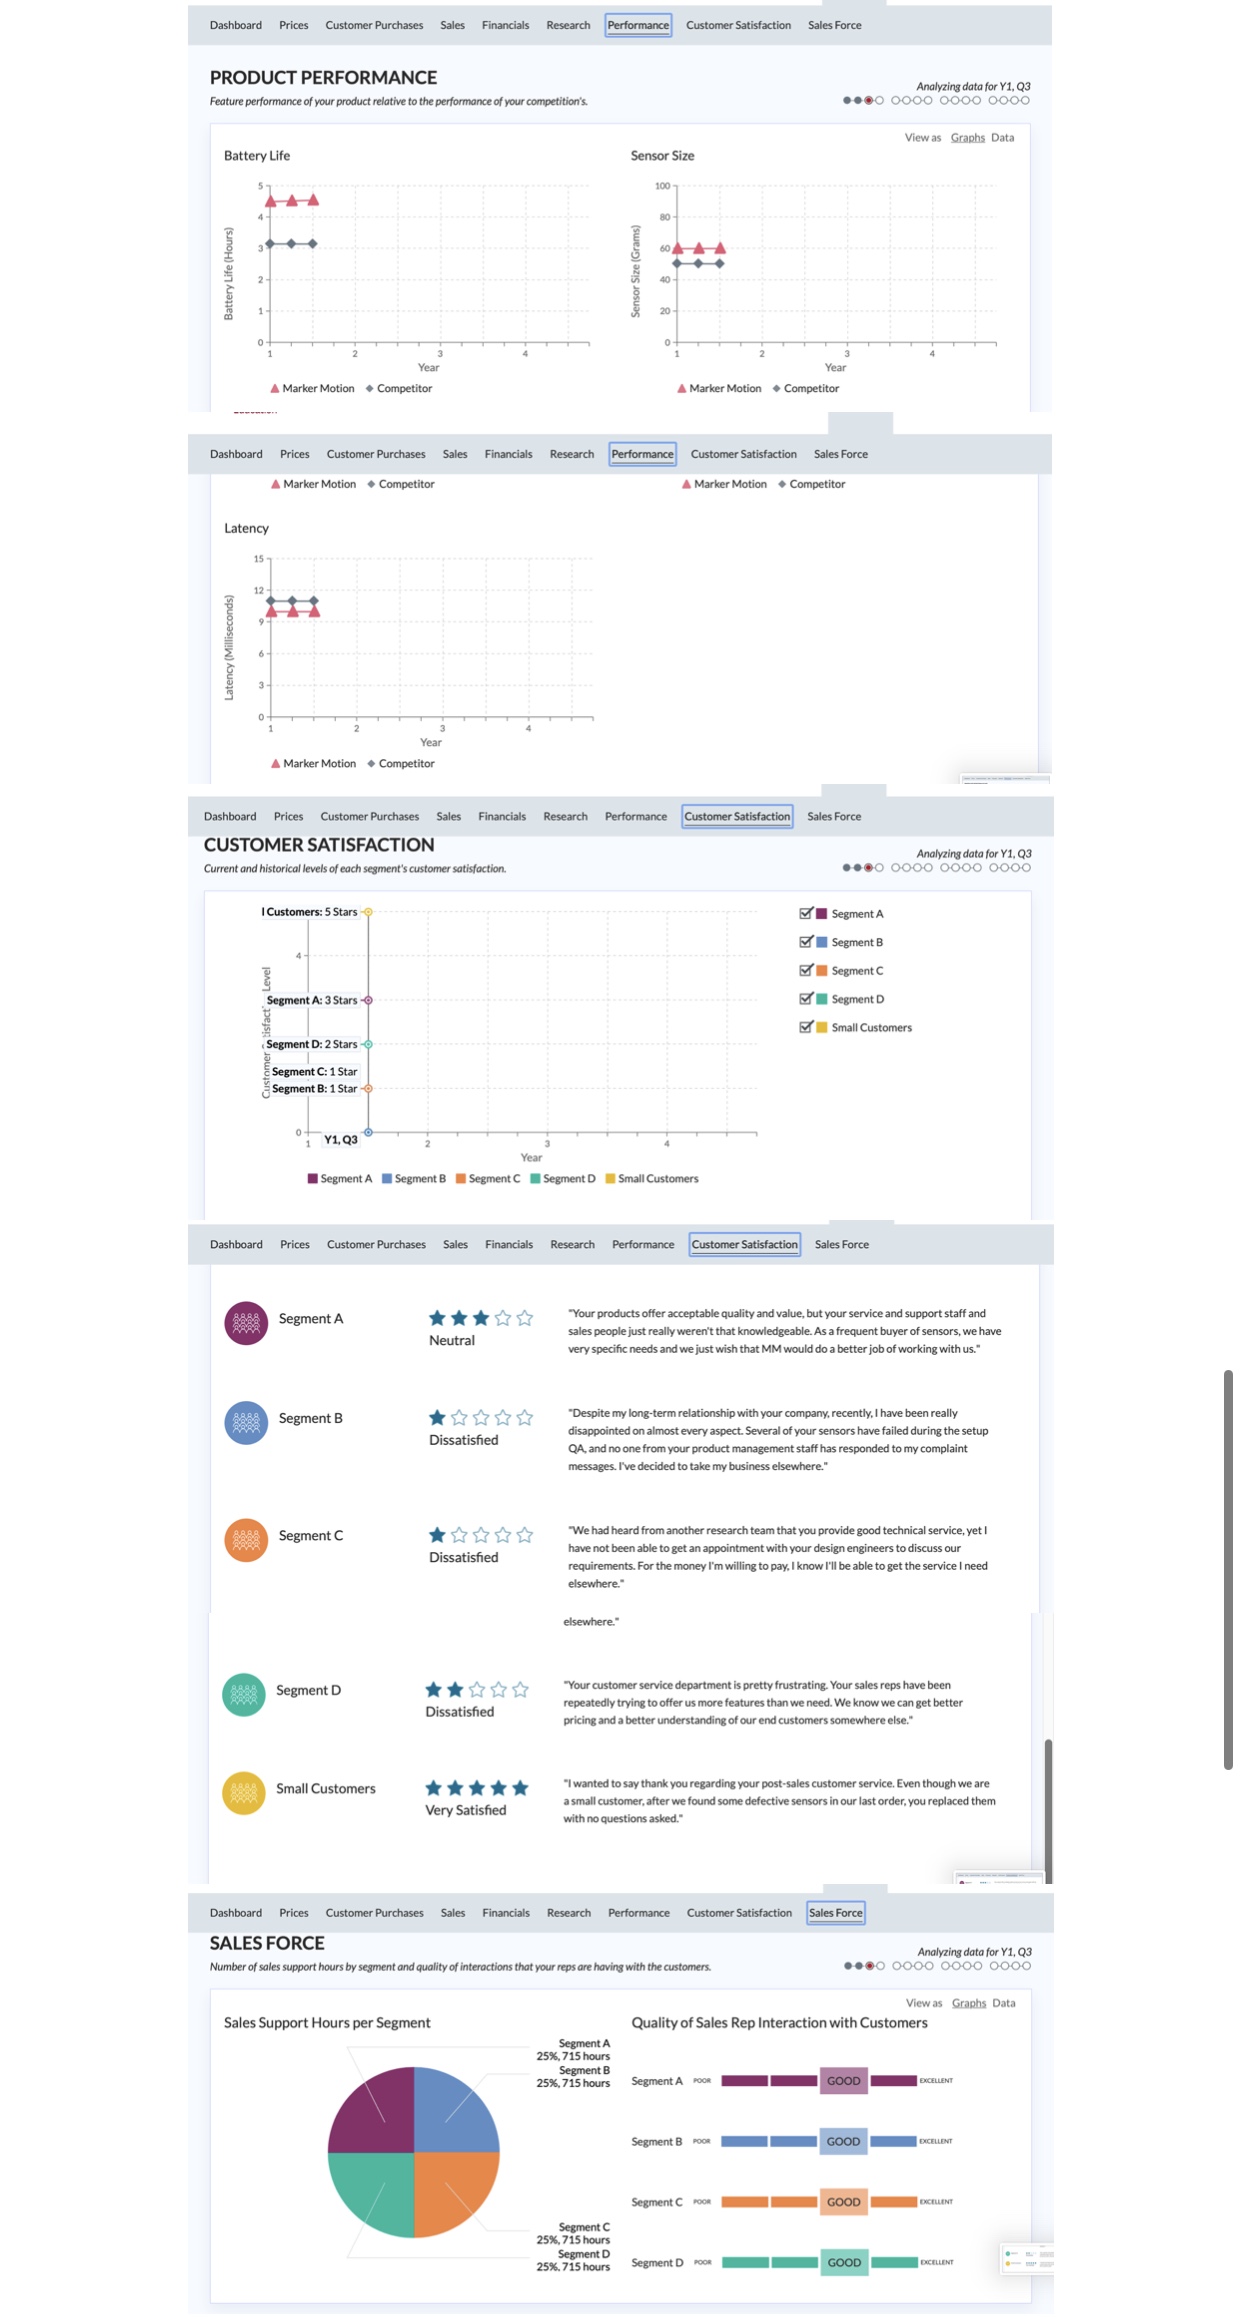
Dashboard Prices Customer Purchases Sales Financials Research Performance Customer Satisfaction Sales Force DASHBOARD Analyzing data for Y1, Q3 High level breakdown of your market share. Market Share Large Customers Small Customers Segment A Segment B Segment C Segment D -0.9% 1-0.2% -0.1% 1-0.1% -0.1% Dashboard Prices Customer Purchases Sales Financials Research Performance Customer Satisfaction Sales Force Segment Share Quarterly Revenue MM 8.51% Large Customers $2,254,913 91.49% MM 11.78% Small Customers so $890,749 88.22% Dashboard Prices Customer Purchases Sales Financials Research Performance Customer Satisfaction Sales Force Unit Sales Profit Margin 30K 24K 12% Unit Sales / Yea 18K 9% 12K 6K Profitability / Year OK - Large Customers Small Customers Dashboard Prices Customer Purchases Sales Financials Research Performance Customer Satisfaction Sales Force Large Customers Small Customers Average Prices Spending on Features $150 $10OK $120 SBOK Average Price / Year $90- $60K $60 $40 $30 - $2OK so+ SOK Year A Large Customers . Small Customers A Battery Life . Sensor Size #Latency Dashboard Prices Customer Purchases Sales Financials Research Performance Customer Satisfaction Sales Force PRICES History of your prices and that of the competition. Analyzing data for Y1, Q3 View as Graphs Data Large Customers Segment A Segment B $150 $150 7 $120 $120 Price / Year $90 $90 $60 e / Year $60 $30 $30- So- So- Marker Motion . Competitor Marker Motion . Competitor Dashboard Prices Customer Purchases Sales Financials Research Performance Customer Satisfaction Sales Force A Marker Motion . Competitor A Marker Motion . Competitor Segment C Segment D $150- $150 $120 Price / Year $90 $90 $60 e/ Yea $60 $30 so So - Marker Motion . Competitor A Marker Motion . CompetitorDashboard Prices Customer Purchases Sales Financials Research Performance Customer Satisfaction Sales Force CUSTOMER PURCHASES Analyzing data for Y1, Q3 Number of units sold per segment over time. ..OO OOOO OOO0 0000 View as Graphs Data Total Customer Unit Sales 20% 16K- Unit Sales / Year 12K - 6K 2K A Large Customers . Small Customers A Segment A . Segment B # Segment C . Segment D Dashboard Prices Customer Purchases Sales Financials Research Performance Customer Satisfaction Sales Force SALES Analyzing data for Y1, Q3 How many units have been sold to new and existing customers. ..0 0900 0900 0900 View as Graphs Data Large Customers Small Customers 20K 10K- Sales to Existing Customers: 8,692 units 16K 8K Unit Sales / Year 12K 8K nit Sales / Yea 6K Sales to New Customers: 9,600 units 4K 2K OK Y1, Q2 OK - Year Sales to New Customers Sales to Existing Customers Sales to New Customers Sales to Existing Customers Dashboard Prices Customer Purchases Sales Financials Research Performance Customer Satisfaction Sales Force View As $ Volume Per Unit Percentages Gross Margin Detail Copy to Clipboard [( Y1, Q1 Y1, Q2 Y1, Q3 Revenue from Large Customers $2,370,194 $2,282,032 $2,254,913 Revenue from Small Customers $890,340 $882,008 $890,749 Total Revenue $3,260,534 $3,164,040 $3,145,662 Variable Cost $1,859,119 $1,810,076 $1,804,446 Gross Margin $1,401,415 $1,353,964 $1,341,216 SG&A Expense $630,000 $630,000 $630,000 R&D Expense $120,000 $120,000 $120,000 Marketing Research Expenditures $130,000 $130,000 $130,000 Other Operating Expense $130,421 $130,421 $130,421 Total Operating Expense $1,010,421 $1,010,421 $1,010,421 Net Income $390,994 $343,543 $330,795 Revenue Net Income $5M $500K SAM $40OK Revenue / Year $3M $300K $2M $20OK SIM SOM $OK Year Year Dashboard Prices Customer Purchases Sales Financials Research Performance Customer Satisfaction Sales Force View As $ Volume Per Unit Percentages Gross Margin Detail Copy to Clipboard Y1, Q1 Y1, Q2 Y1,Q3 Revenue from Large Customers $124.90 $124.75 $124.71 Revenue from Small Customers $124.96 $124.96 $124.96 Total Revenue $124.92 $124.81 $124.78 Variable Cost $71.23 $71.40 $71.58 Gross Margin $53.69 $53.41 $53.20 SG&A Expense $24.14 $24.8 $24.99 R&D Expense $4.60 $4.73 $4.76 Marketing Research Expenditures $4.98 $5.13 $5.16 Other Operating Expense $5.00 $5.14 $5.17 Total Operating Expense $38.71 $39.86 $40.08 Net Income $14.98 $13.55 $13.12 Cumulative Profit $0.00 $0.00 $0.00Dashboard Prices Customer Purchases Sales Financials Research Performance Customer Satisfaction Sales Force View As $ Volume Per Unit Percentages Gross Margin Detail Copy to Clipboard 9 Y1, Q1 Y1, Q2 Y1,Q3 Revenue from Large Customers $124.90 $124.7 $124.71 Revenue from Small Customers $124.96 $124.96 $124.96 Total Revenue $124.92 $124.81 $124.78 Variable Cost $71.23 $71.40 $71.58 Gross Margin $53.69 $53.41 $53.20 SG&A Expense $24.14 $24.85 $24.99 R&D Expense $4.60 $4.73 $4.76 Marketing Research Expenditures $4.98 $5.13 $5.16 Other Operating Expense $5.00 $5.14 $5.17 Total Operating Expense $38.71 $39.86 $40.08 Net Income $14.98 $13.55 $13.12 Cumulative Profit $0.00 $0.00 $0.00 Revenue Net Income $5M- $50OK SAM $4OOK Revenue / Year $3M * $30OK $2M $20OK SIM SOM SOK Year Year Dashboard Prices Customer Purchases Sales Financials Research Performance Customer Satisfaction Sales Force View As $ Volume Per Unit Percentages Gross Margin Detail Copy to Clipboard [( Y1,Q1 Y1, Q2 Y1, Q3 Revenue from Large Customers 72.7% 72.1% 71.7% Revenue from Small Customers 27.3% 27.9% 28.3% Total Revenue 100.0% 100.0% 100.0% Variable Cost 57.0% 57.29 57.4% Gross Margin 43.0% 42.8% 42.6% SG&A Expense 19.3% 19.9% 20.0% R&D Expense 3.7% 3.8% 3.8% Marketing Research Expenditures 4.0% 4.1% 4.1% Other Operating Expense 4.0% 4.1% 4.1% Total Operating Expense 31.09 31.9% 32.1% Net Income 12.09% 10.9% 10.5% Cumulative Profit 0.0% 0.0% 0.0% Dashboard Prices Customer Purchases Sales Financials Research Performance Customer Satisfaction Sales Force FINANCIALS Analyzing data for Y1, Q3 View As $ Volume Per Unit Percentages Gross Margin Detail Copy to Clipboard ( Y1,Q1 Y1, Q2 Y1, Q3 Segment A $509,824 $486,385 $474,410 Segment B $124,018 $108,799 $104,758 Segment C $111,170 $105,496 $104,468 Segment D $273.559 $275,253 $277,048 Small Customers $382,846 $378,030 $380,532 Share by Segment X Axis: Battery Life Y Axis: Sensor Size Large Customers Small Customers Sensor Size (Grams) 8 8 8 8 8 6.91% Segment A Segment B 21.16% Segment C Segment D Competitor 3.84% . Marker Motion 4.27% Competitor Dashboard Prices Customer Purchases Sales Financials Research Performance Customer Satisfaction Sales Force PRODUCT PERFORMANCE Analyzing data for Y1, Q3 Feature performance of your product relative to the performance of your competition's. ..oo OOOO OOO0 0900 View as Graphs Data Battery Life Sensor Size 100 Battery Life (Hours) Sensor Size (Grams) 60 A Marker Motion . Competitor A Marker Motion . CompetitorDashboard Prices Customer Purchases Sales Financials Research Performance Customer Satisfaction Sales Force PRODUCT PERFORMANCE Feature performance of your product relative to the performance of your competition's Analyzing data for Y1, Q3 View as Graphs Data Battery Life Sensor Size 100 Battery Life (Hours) Sensor Size (Grams) Marker Motion . Competitor A Marker Motion . Competitor Dashboard Prices Customer Purchases Sales Financials Research Performance Customer Satisfaction Sales Force A Marker Motion . Competitor A Marker Motion . Competitor Latency 15 12- Latency (Milliseconds Marker Motion . Competitor Dashboard Prices Customer Purchases Sales Financials Research Performance Customer Satisfaction Sales Force CUSTOMER SATISFACTION Current and historical levels of each segme Analyzing data for Y1, Q3 her satisfaction. I Customers: 5 Stars Segment A Segment B Segment C Segment A: 3 Stars - Segment D Small Customers Segment D: 2 Stars Segment C: 1 Star Segment B: 1 Star - Y1, Q3 Year Segment A Segment B Segment C Segment D Small Customers Dashboard Prices Customer Purchases Sales Financials Research Performance Customer Satisfaction Sales Force Segment A "Your products offer acceptable quality and value, but your service and support staff and Neutral ales people just really weren't that knowledgeable. As a frequent buyer of sensors, we have very specific needs and we just wish that MM would do a better job of working with us." Segment B "Despite my long-term relationship with your company, recently, I have been really Dissatisfied disappointed on almost every aspect. Several of your sensors have failed during the setup QA, and no one from your product management staff has responded to my complaint ages. I've decided to take my business elsewhere." Segment C "We had heard from another research team that you provide good technical service, yet I Dissatisfied have not been able to get an appointment with your design engineers to discuss our requirements. For the money I'm willing to pay, I know I'll be able to get the service I need elsewhere." elsewhere." Segment D "Your customer service department is pretty frustrating. Your sales reps have been Dissatisfied repeatedly trying to offer us more features than we need. We know we can get better pricing and a better understanding of our end customers somewhere else." Small Customers "I wanted to say thank you regarding your post-sales customer service. Even though we are Very Satisfied a small customer, after we found some defective sensors in our last order, you replaced them with no questions asked." Dashboard Prices Customer Purchases Sales Financials Research Performance Customer Satisfaction Sales Force SALES FORCE Number of sales support hours by segment nteractions that your reps are having with the customers. Analyzing data for Y1, Q3 View as Graphs Data Sales Support Hours per Segment Quality of Sales Rep Interaction with Customers Segment A 25%, 715 hours Segment B 25%, 715 hours Segment A room GOOD Segment B POOR GOOD legment C room GOOD EXCELLENT Segment C 25%, 715 hours Segment D 25%. 715 hours Segment D POOR GOOD EXCELLENT