MAT150.5 Statistics Online Course Assignment #3 1. Make a frequency distribution for the following data of inches of rainfall in Brooklyn per year, using 6
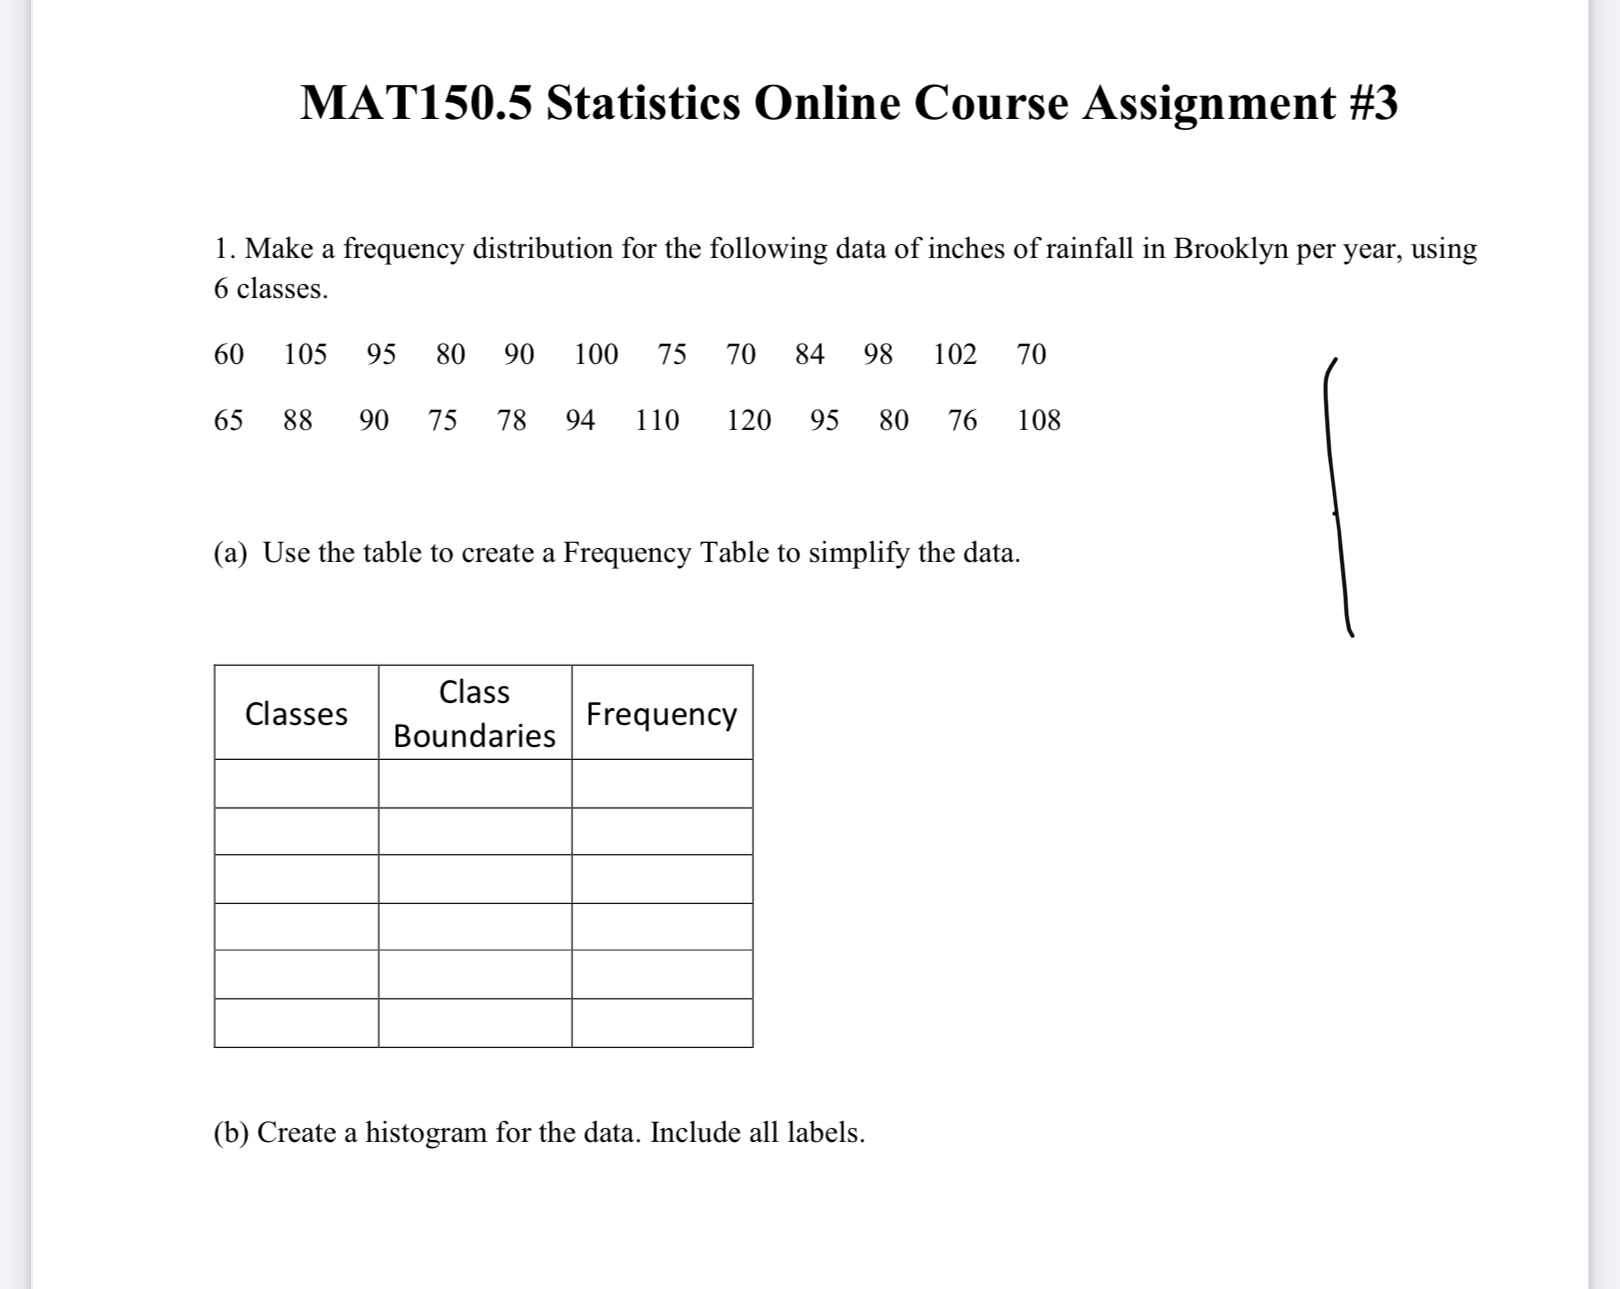
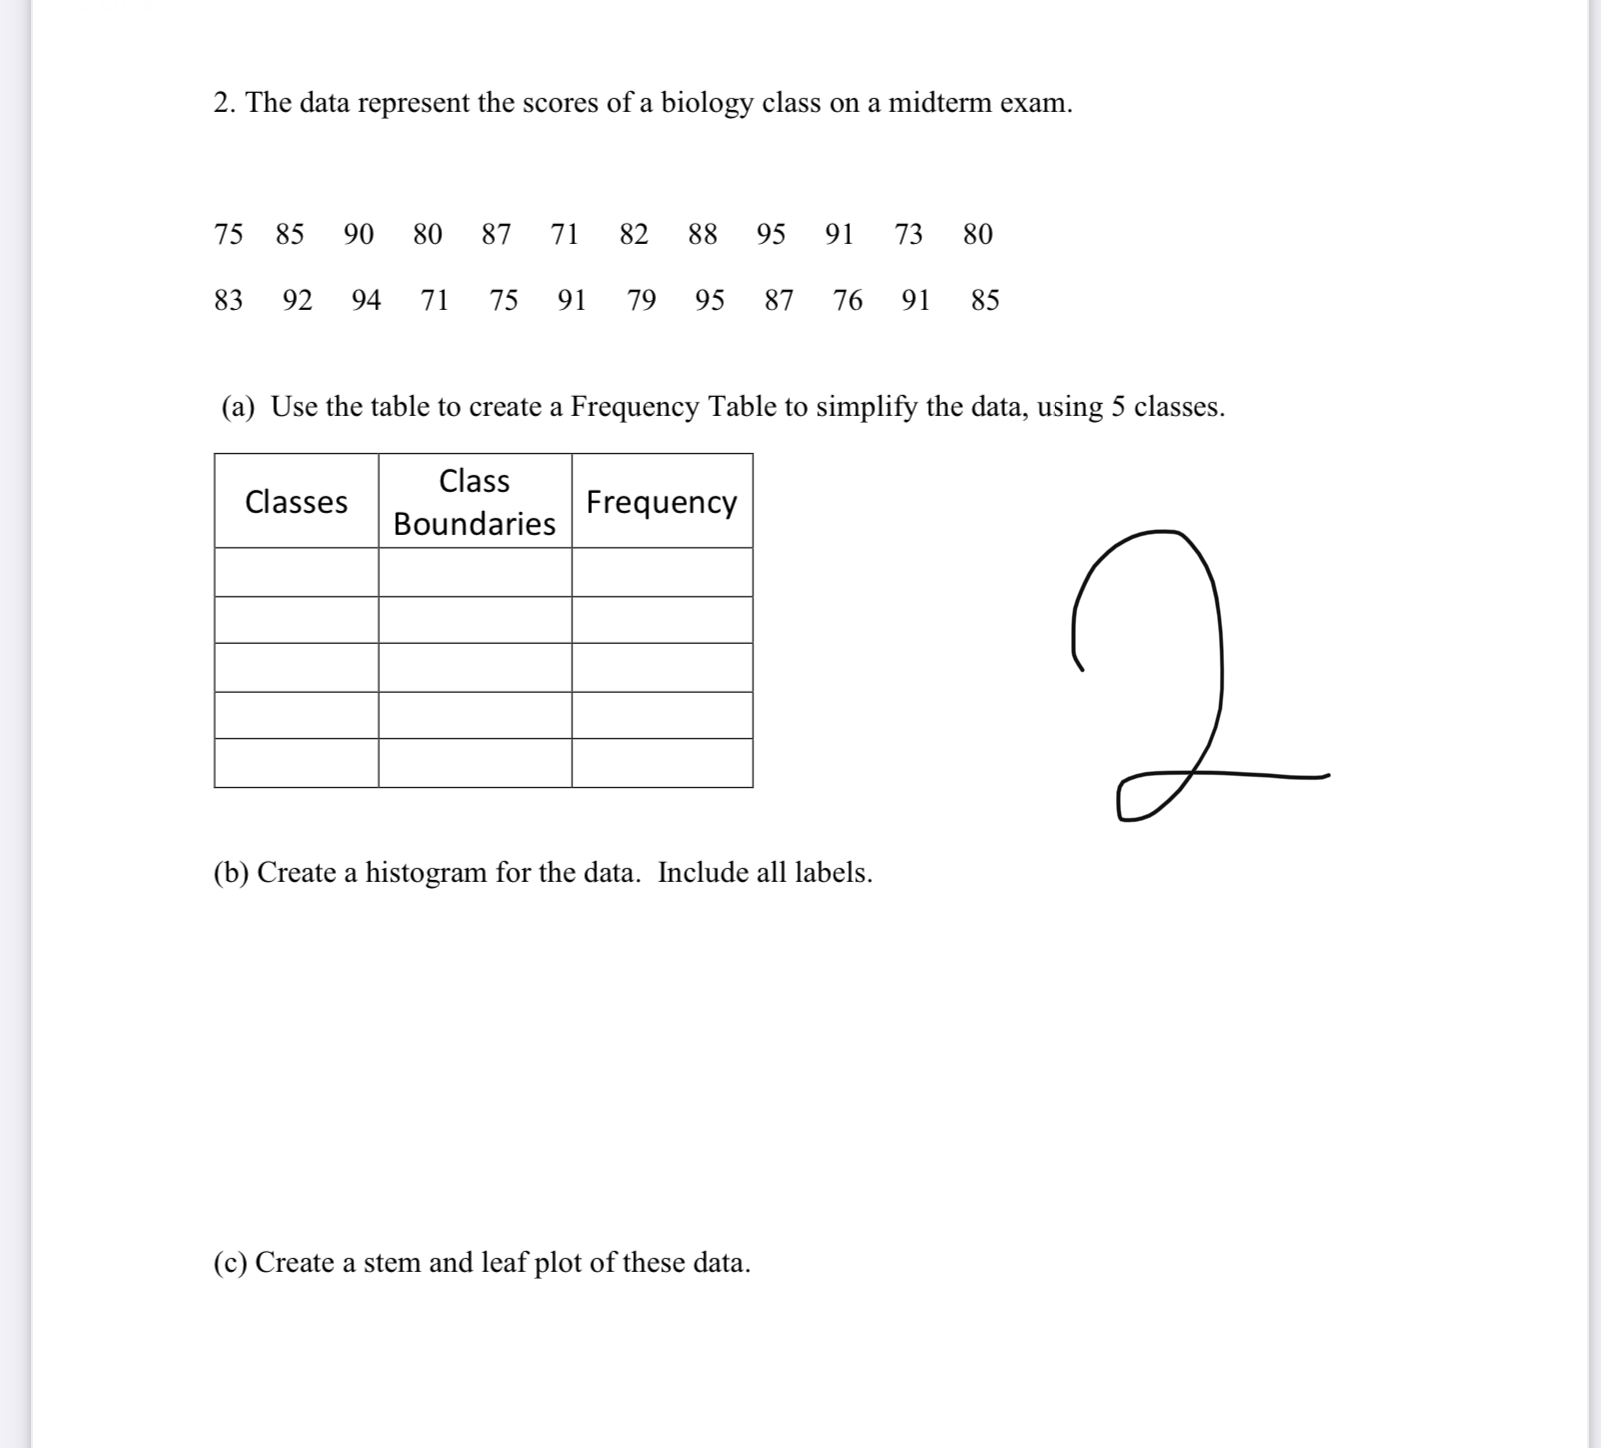
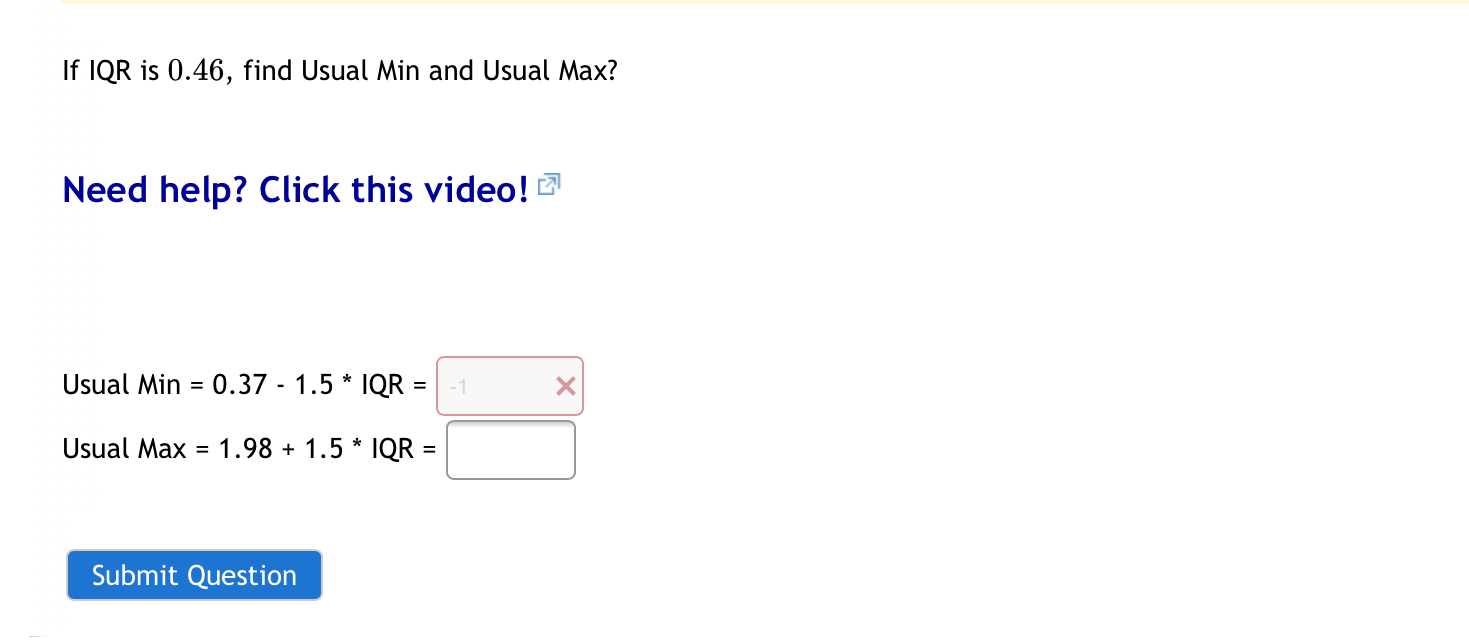
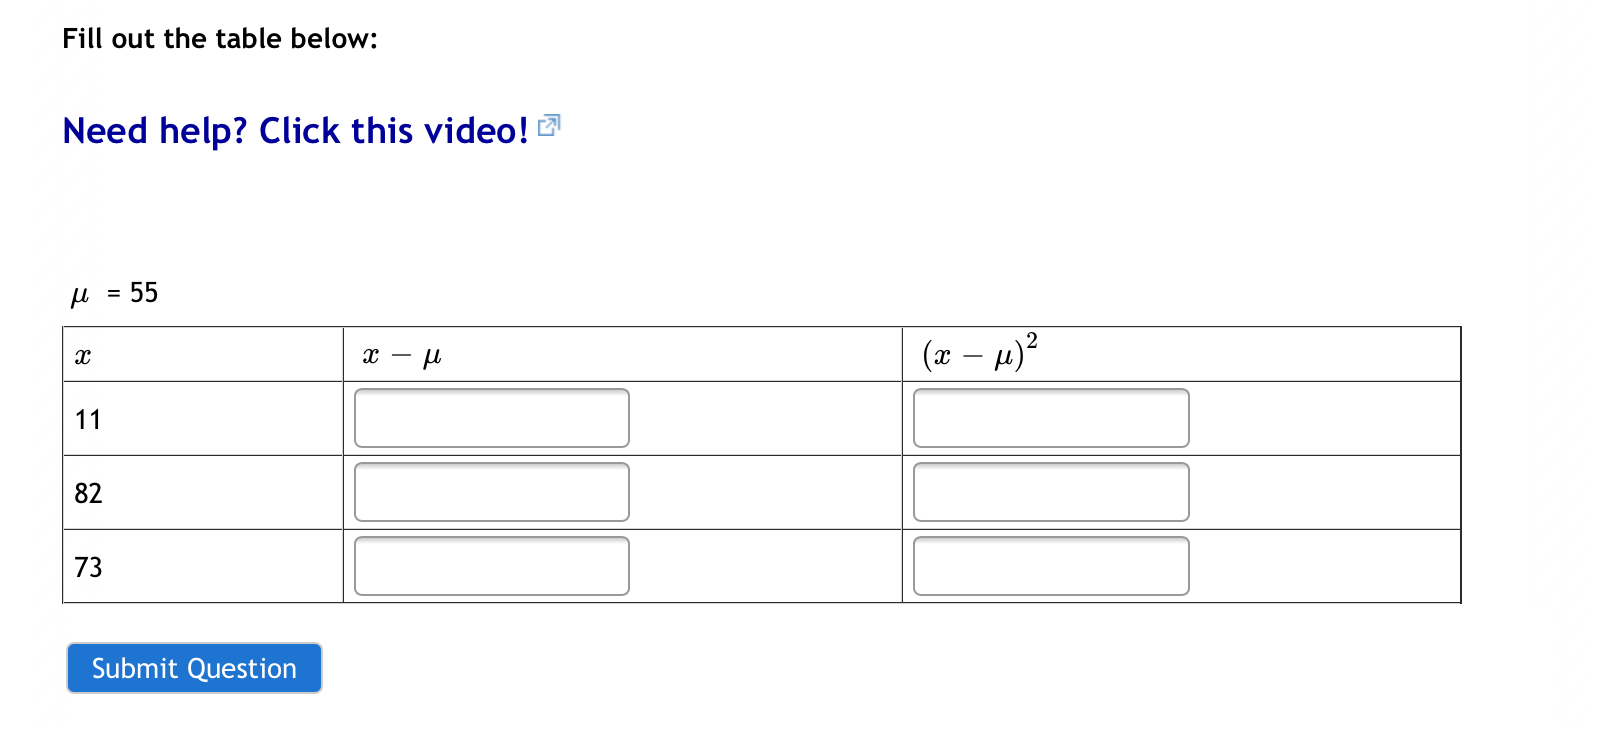
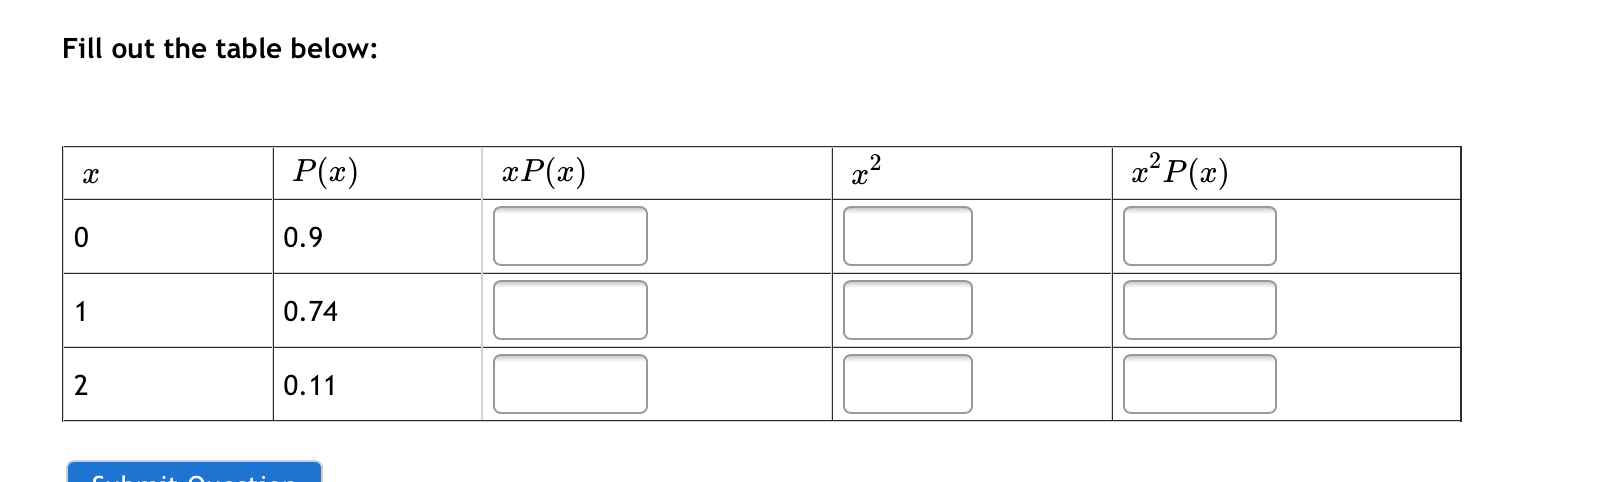
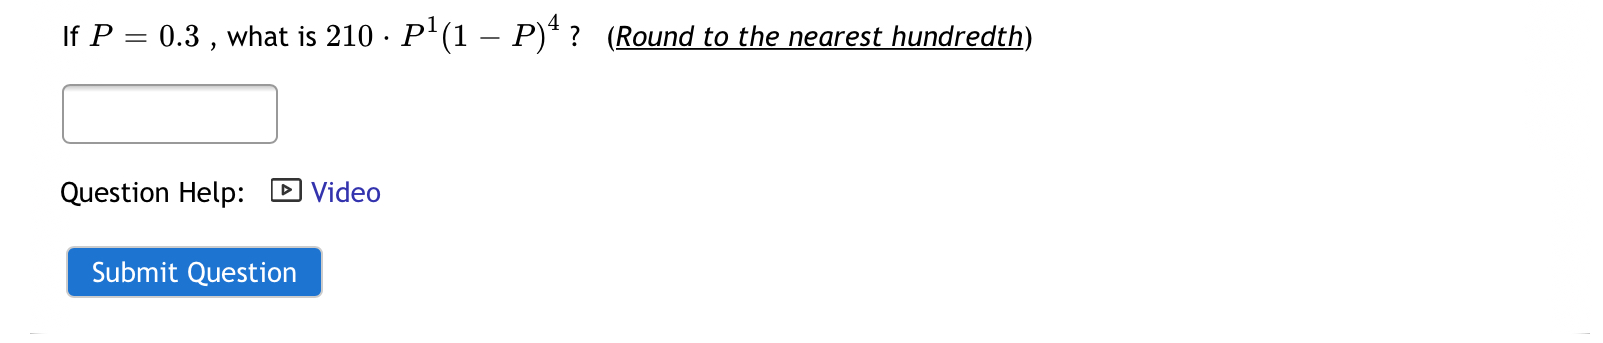
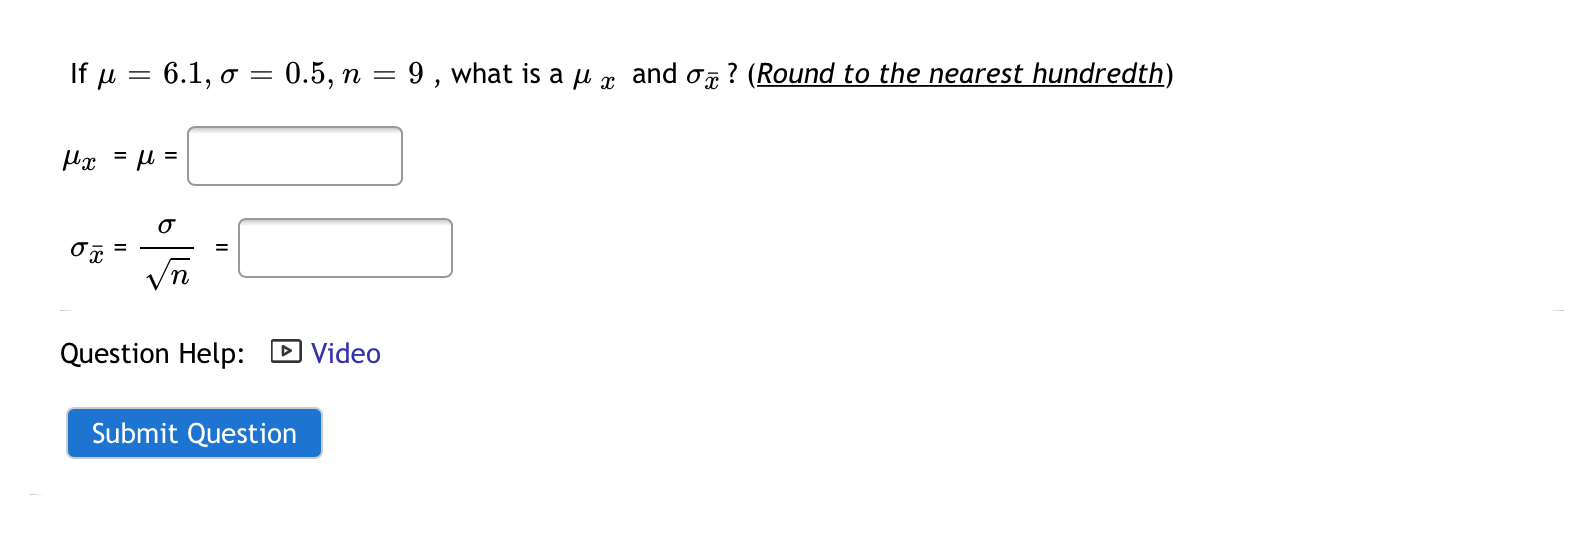
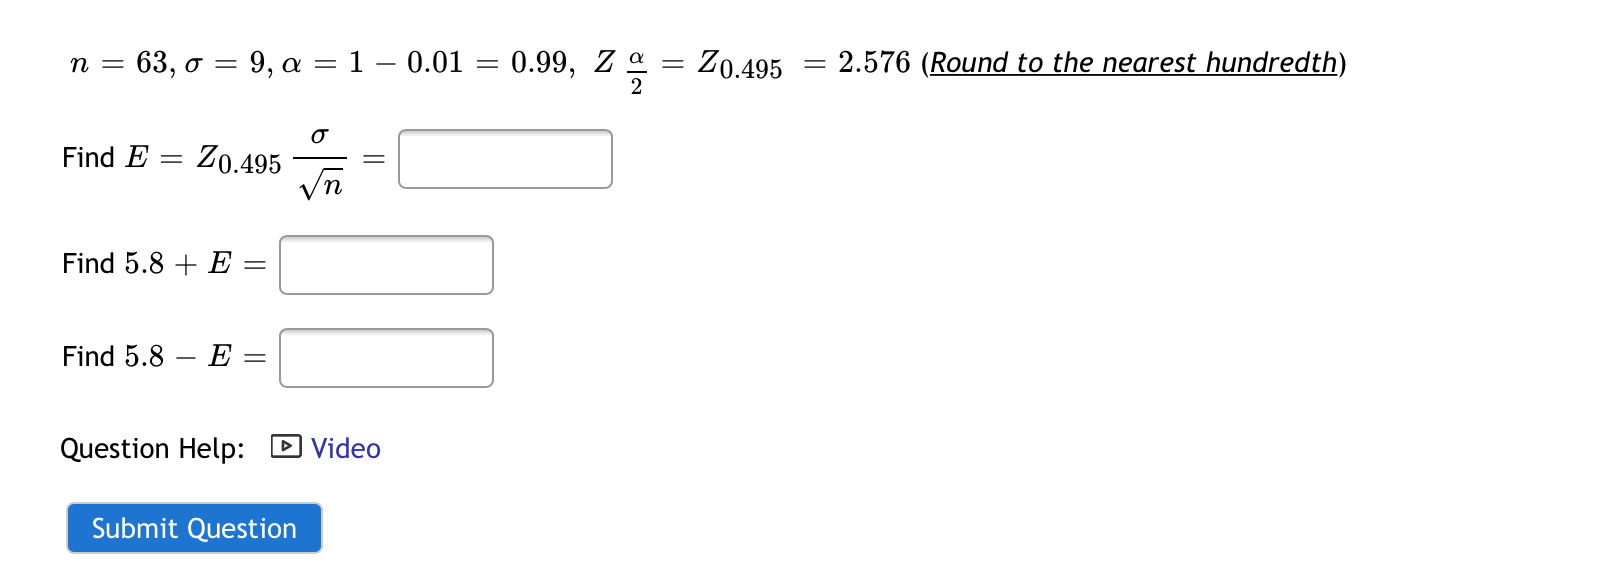
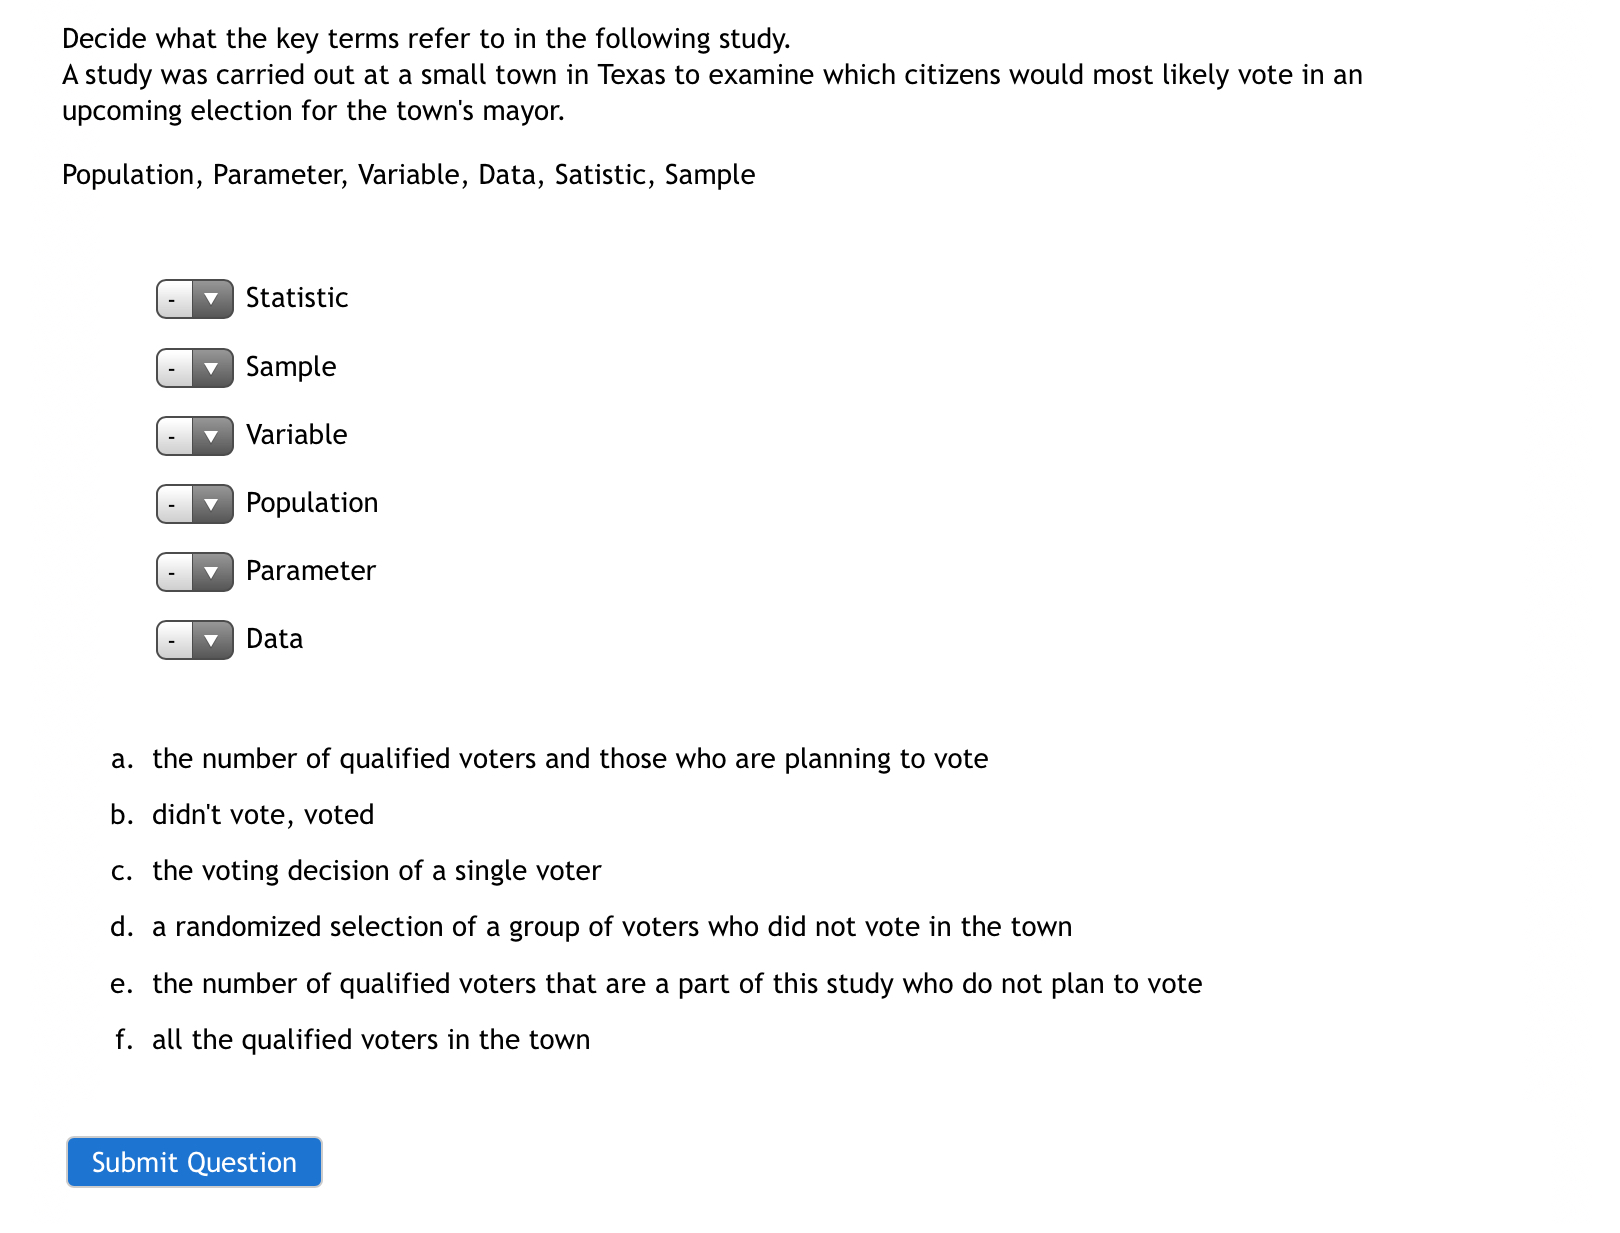
MAT150.5 Statistics Online Course Assignment #3 1. Make a frequency distribution for the following data of inches of rainfall in Brooklyn per year, using 6 classes. 60 105 95 80 90 100 75 70 84 98 102 70 65 88 90 75 78 94 110 120 95 80 76 108 (a) Use the table to create a Frequency Table to simplify the data. Class Classes Boundaries Frequency (b) Create a histogram for the data. Include all labels.MAT150.5 Statistics Online Course Assignment #3 1. Make a frequency distribution for the following data of inches of rainfall in Brooklyn per year, using 6 classes. 60 105 95 80 90 100 75 70 84 98 102 70 65 88 90 75 78 94 110 120 95 80 76 108 (a) Use the table to create a Frequency Table to simplify the data. Class Classes Boundaries Frequency (b) Create a histogram for the data. Include all labels.2. The data represent the scores of a biology class on a midterm exam. 75 85 90 80 87 71 82 88 95 91 73 80 83 92 94 71 75 91 79 95 87 76 91 85 (a) Use the table to create a Frequency Table to simplify the data, using 5 classes. Class Classes Frequency Boundaries (b) Create a histogram for the data. Include all labels. (c) Create a stem and leaf plot of these data.2. The data represent the scores of a biology class on a midterm exam. 75 85 90 80 87 71 82 88 95 91 73 80 83 92 94 71 75 91 79 95 87 76 91 85 (a) Use the table to create a Frequency Table to simplify the data, using 5 classes. Class Classes Frequency Boundaries (b) Create a histogram for the data. Include all labels. (c) Create a stem and leaf plot of these data.If IQR is 0.46, find Usual Min and Usual Max? Need help? Click this video! Usual Min = 0.37 - 1.5 * IQR = -1 X Usual Max = 1.98 + 1.5 * IQR = Submit QuestionIf IQR is 0.46, find Usual Min and Usual Max? Need help? Click this video! Usual Min = 0.37 - 1.5 * IQR = -1 X Usual Max = 1.98 + 1.5 * IQR = Submit QuestionFill out the table below: Need help? Click this video! 5' 11 :] 82 [:1 73 :] Submit Question Fill out the table below: P(ac) x2 P(ac) 0 0.9 1 0.74 2 0. 11Fill out the table below: P(ac) x2 P(ac) 0 0.9 1 0.74 2 0. 11If P = 0.3 , what is 210 . P(1 - P)? (Round to the nearest hundredth) Question Help: D Video Submit QuestionIf p, = 6.1, 0' = 0.5, n = 9 , what is a ,u m and 0-3-3? (Round to the nearest hundredth) \" [:1 0' : = :1: Question Help: El Video Submit Question n = 63, 0 = 9, a = 1 - 0.01 = 0.99, Z a = Zo.495 = 2.576 (Round to the nearest hundredth) O Find E = Zo.495 Find 5.8 + E = Find 5.8 - E = Question Help: DVideo Submit QuestionDecide what the key terms refer to in the following study. A study was carried out at a small town in Texas to examine which citizens would most likely vote in an upcoming election for the town's mayor. Population, Parameter, Variable, Data, Satistic, Sample a. the number of qualified voters and those who are planning to vote b. didn't vote, voted c. the voting decision of a single voter d. a randomized selection of a group of voters who did not vote in the town e. the number of qualified voters that are a part of this study who do not plan to vote f. all the qualified voters in the town Submit
Step by Step Solution
There are 3 Steps involved in it
Step: 1
Get Instant Access to Expert-Tailored Solutions
See step-by-step solutions with expert insights and AI powered tools for academic success
Step: 2
Step: 3
Ace Your Homework with AI
Get the answers you need in no time with our AI-driven, step-by-step assistance