

Answered step by step
Verified Expert Solution
Question
1 Approved Answer
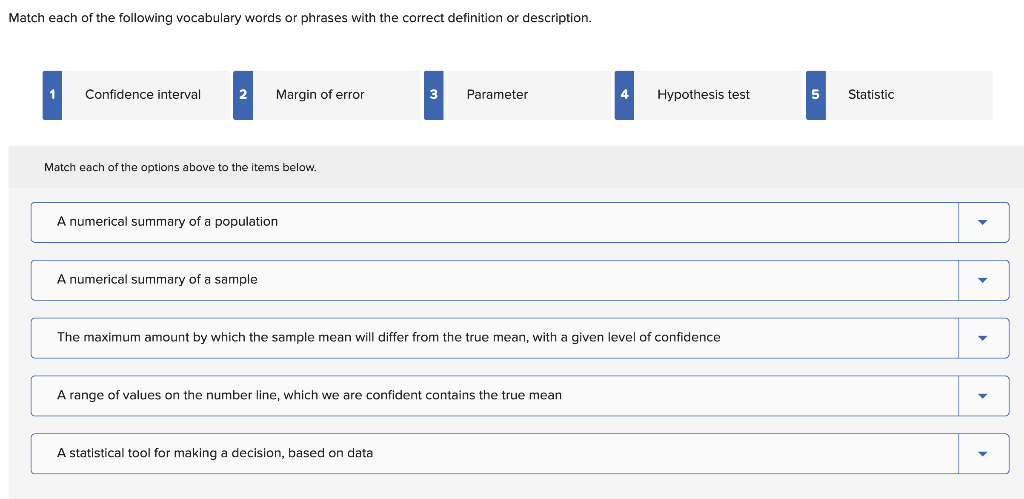
Match each of the following vocabulary words or phrases with the correct definition or description. Confidence interval 2 Margin of error 3 Parameter 4 Hypothesis
Step by Step Solution
There are 3 Steps involved in it
Step: 1

Get Instant Access to Expert-Tailored Solutions
See step-by-step solutions with expert insights and AI powered tools for academic success
Step: 2

Step: 3
Ace Your Homework with AI
Get the answers you need in no time with our AI-driven, step-by-step assistance
Get Started
Finite Math And Applied Calculus
Authors: Stefan Waner, Steven Costenoble
7th Edition
1337515566, 9781337515566