Question
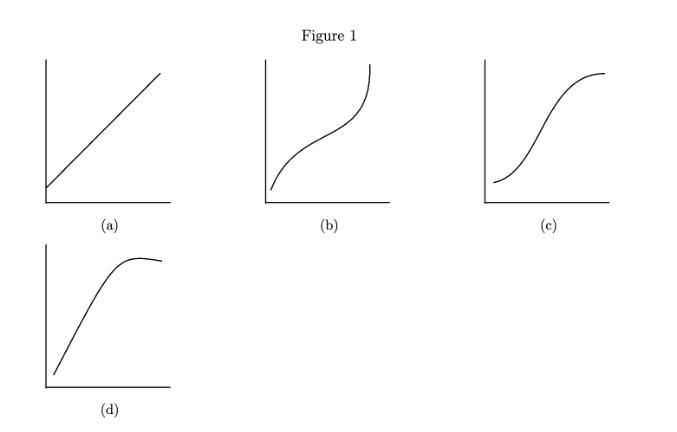
Match the graphs in figure 1 to the four scenarios listed below 19. If player talent is the same price for all teams (players


Match the graphs in figure 1 to the four scenarios listed below 19. If player talent is the same price for all teams (players can have different talent levels), which graph most likely represents wins as a function of cost? 20. In figure 1, which graph would most likely be winning percentage as a function of talent? 21. Which graph could be a cost function where marginal cost is constant? 22. Which function could represent ticket sales as a function of winning percentage? (Using the example of the 1930s Yankees from class.) (a) (d) Figure 1 (b) (c)
Step by Step Solution
There are 3 Steps involved in it
Step: 1

Get Instant Access to Expert-Tailored Solutions
See step-by-step solutions with expert insights and AI powered tools for academic success
Step: 2

Step: 3

Ace Your Homework with AI
Get the answers you need in no time with our AI-driven, step-by-step assistance
Get StartedRecommended Textbook for
Introduction to graph theory
Authors: Douglas B. West
2nd edition
131437372, 978-0131437371
Students also viewed these Mathematics questions
Question
Answered: 1 week ago
Question
Answered: 1 week ago
Question
Answered: 1 week ago
Question
Answered: 1 week ago
Question
Answered: 1 week ago
Question
Answered: 1 week ago
Question
Answered: 1 week ago
Question
Answered: 1 week ago
Question
Answered: 1 week ago
Question
Answered: 1 week ago
Question
Answered: 1 week ago
Question
Answered: 1 week ago
Question
Answered: 1 week ago
Question
Answered: 1 week ago
Question
Answered: 1 week ago
Question
Answered: 1 week ago
Question
Answered: 1 week ago
Question
Answered: 1 week ago
Question
Answered: 1 week ago
Question
Answered: 1 week ago
Question
Answered: 1 week ago
View Answer in SolutionInn App


