Question
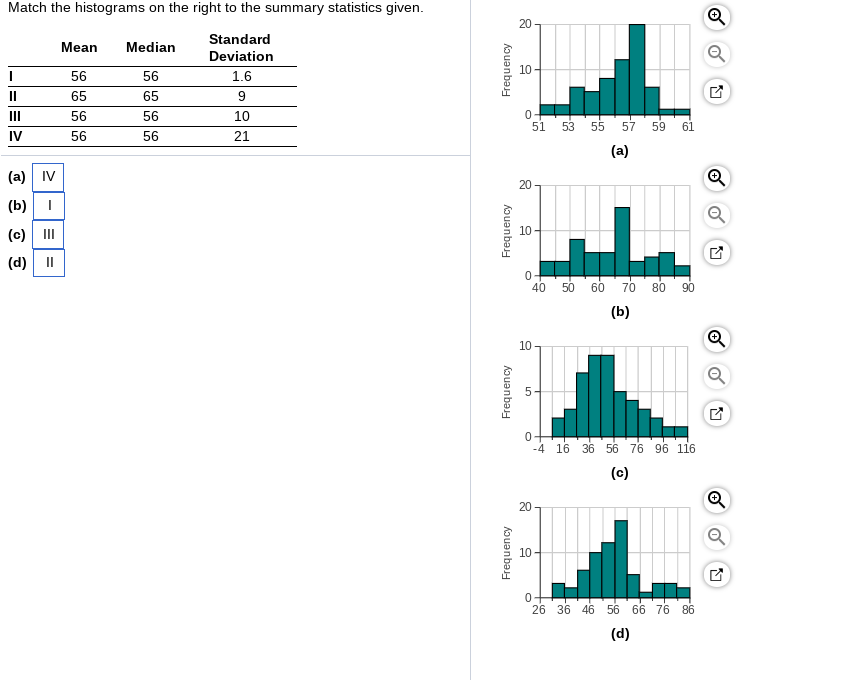
Match the histograms on the right to the summary statistics given. Standard Deviation 1.6 | || III IV (a) IV (b) I (c) III

Match the histograms on the right to the summary statistics given. Standard Deviation 1.6 | || III IV (a) IV (b) I (c) III (d) II Mean 56 65 56 56 Median 56 65 56 56 9 10 21 Frequency Frequency 20 Frequency 10 0 20 10 51 53 0- 40 50 60 10 Frequency O 20 9 55 57 59 (a) 70 (b) 80 61 0 26 36 46 56 66 76 (d) 90 -4 16 36 56 76 96 116 (c) 86 Q Q O N N Q Q K
Step by Step Solution
3.41 Rating (160 Votes )
There are 3 Steps involved in it
Step: 1
The summary statistics are given below I II III IV 20 10 The following histogram are ...
Get Instant Access to Expert-Tailored Solutions
See step-by-step solutions with expert insights and AI powered tools for academic success
Step: 2

Step: 3

Ace Your Homework with AI
Get the answers you need in no time with our AI-driven, step-by-step assistance
Get StartedRecommended Textbook for
Fundamentals Of Statistics
Authors: Michael Sullivan
5th Edition
134508306, 134508300, 978-0134508306
Students also viewed these Mathematics questions
Question
Answered: 1 week ago
Question
Answered: 1 week ago
Question
Answered: 1 week ago
Question
Answered: 1 week ago
Question
Answered: 1 week ago
Question
Answered: 1 week ago
Question
Answered: 1 week ago
Question
Answered: 1 week ago
Question
Answered: 1 week ago
Question
Answered: 1 week ago
Question
Answered: 1 week ago
Question
Answered: 1 week ago
Question
Answered: 1 week ago
Question
Answered: 1 week ago
Question
Answered: 1 week ago
Question
Answered: 1 week ago
Question
Answered: 1 week ago
Question
Answered: 1 week ago
Question
Answered: 1 week ago
View Answer in SolutionInn App


