Question
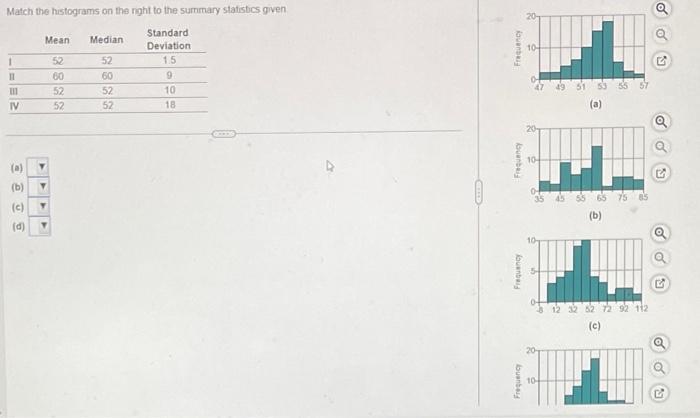
Match the histograms on the right to the summary statistics given Standard Mean Median Deviation 1 52 52 15 60 60 9 52 52

Match the histograms on the right to the summary statistics given Standard Mean Median Deviation 1 52 52 15 60 60 9 52 52 10 IV 52 52 18 (a) (b) (c) T (d) Frequency fouenbai Frequency 10- 10- 30 (b) 62 72 92 112 (c) Q
Step by Step Solution
3.40 Rating (153 Votes )
There are 3 Steps involved in it
Step: 1
Based on the provided information the histograms match the summary statistics as follows a Mean 52 S...
Get Instant Access to Expert-Tailored Solutions
See step-by-step solutions with expert insights and AI powered tools for academic success
Step: 2

Step: 3

Ace Your Homework with AI
Get the answers you need in no time with our AI-driven, step-by-step assistance
Get StartedRecommended Textbook for
Fundamentals Of Statistics
Authors: Michael Sullivan
5th Edition
134508306, 134508300, 978-0134508306
Students also viewed these Accounting questions
Question
Answered: 1 week ago
Question
Answered: 1 week ago
Question
Answered: 1 week ago
Question
Answered: 1 week ago
Question
Answered: 1 week ago
Question
Answered: 1 week ago
Question
Answered: 1 week ago
Question
Answered: 1 week ago
Question
Answered: 1 week ago
Question
Answered: 1 week ago
Question
Answered: 1 week ago
Question
Answered: 1 week ago
Question
Answered: 1 week ago
Question
Answered: 1 week ago
Question
Answered: 1 week ago
Question
Answered: 1 week ago
Question
Answered: 1 week ago
Question
Answered: 1 week ago
Question
Answered: 1 week ago
Question
Answered: 1 week ago
Question
Answered: 1 week ago
Question
Answered: 1 week ago
View Answer in SolutionInn App


