

Answered step by step
Verified Expert Solution
Question
1 Approved Answer
Matching Cost Behavior Descriptions to Cost Behavior Graphs Select the graph (A through K) that best matches the numbered (1 through 6) descriptions of various
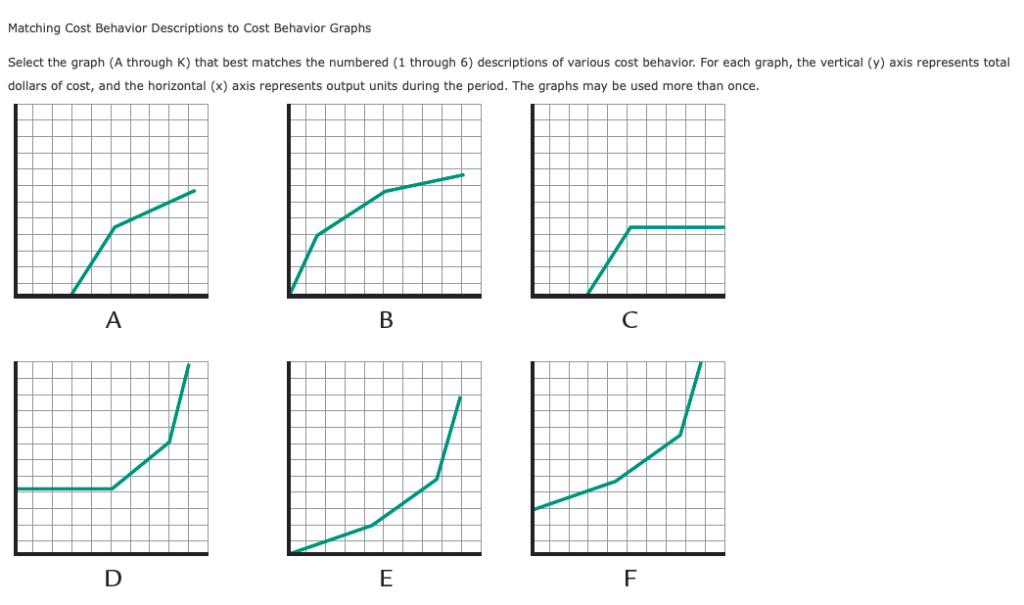
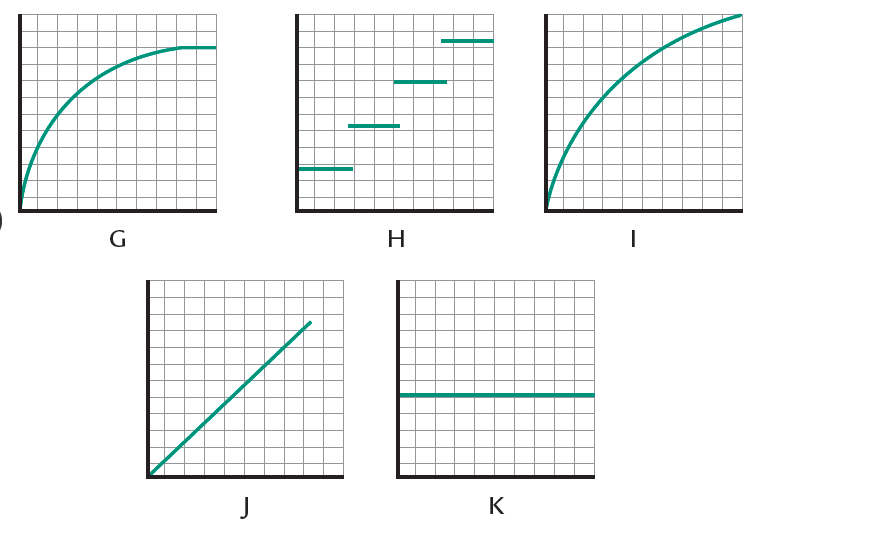
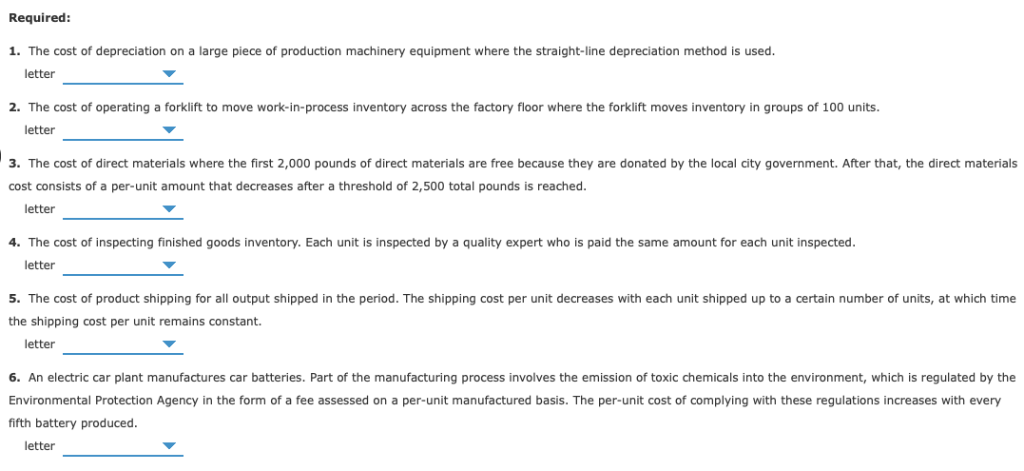
Matching Cost Behavior Descriptions to Cost Behavior Graphs Select the graph (A through K) that best matches the numbered (1 through 6) descriptions of various cost behavior. For each graph, the vertical (y) axis represents total dollars of cost, and the horizontal (x) axis represents output units during the period. The graphs may be used more than once
Step by Step Solution
There are 3 Steps involved in it
Step: 1

Get Instant Access to Expert-Tailored Solutions
See step-by-step solutions with expert insights and AI powered tools for academic success
Step: 2

Step: 3
Ace Your Homework with AI
Get the answers you need in no time with our AI-driven, step-by-step assistance
Get Started
Primary Science Audit And Test
Authors: Jenny Byrne, Andri Christodoulou, John Sharp
4th Edition
1446282732, 978-1446282731