Answered step by step
Verified Expert Solution
Link Copied!

Question

1 Approved Answer

MATCHING: For the following problems, write the letter of the most appropriate statistical analysis technique next to the story. Note: each answer choice may be
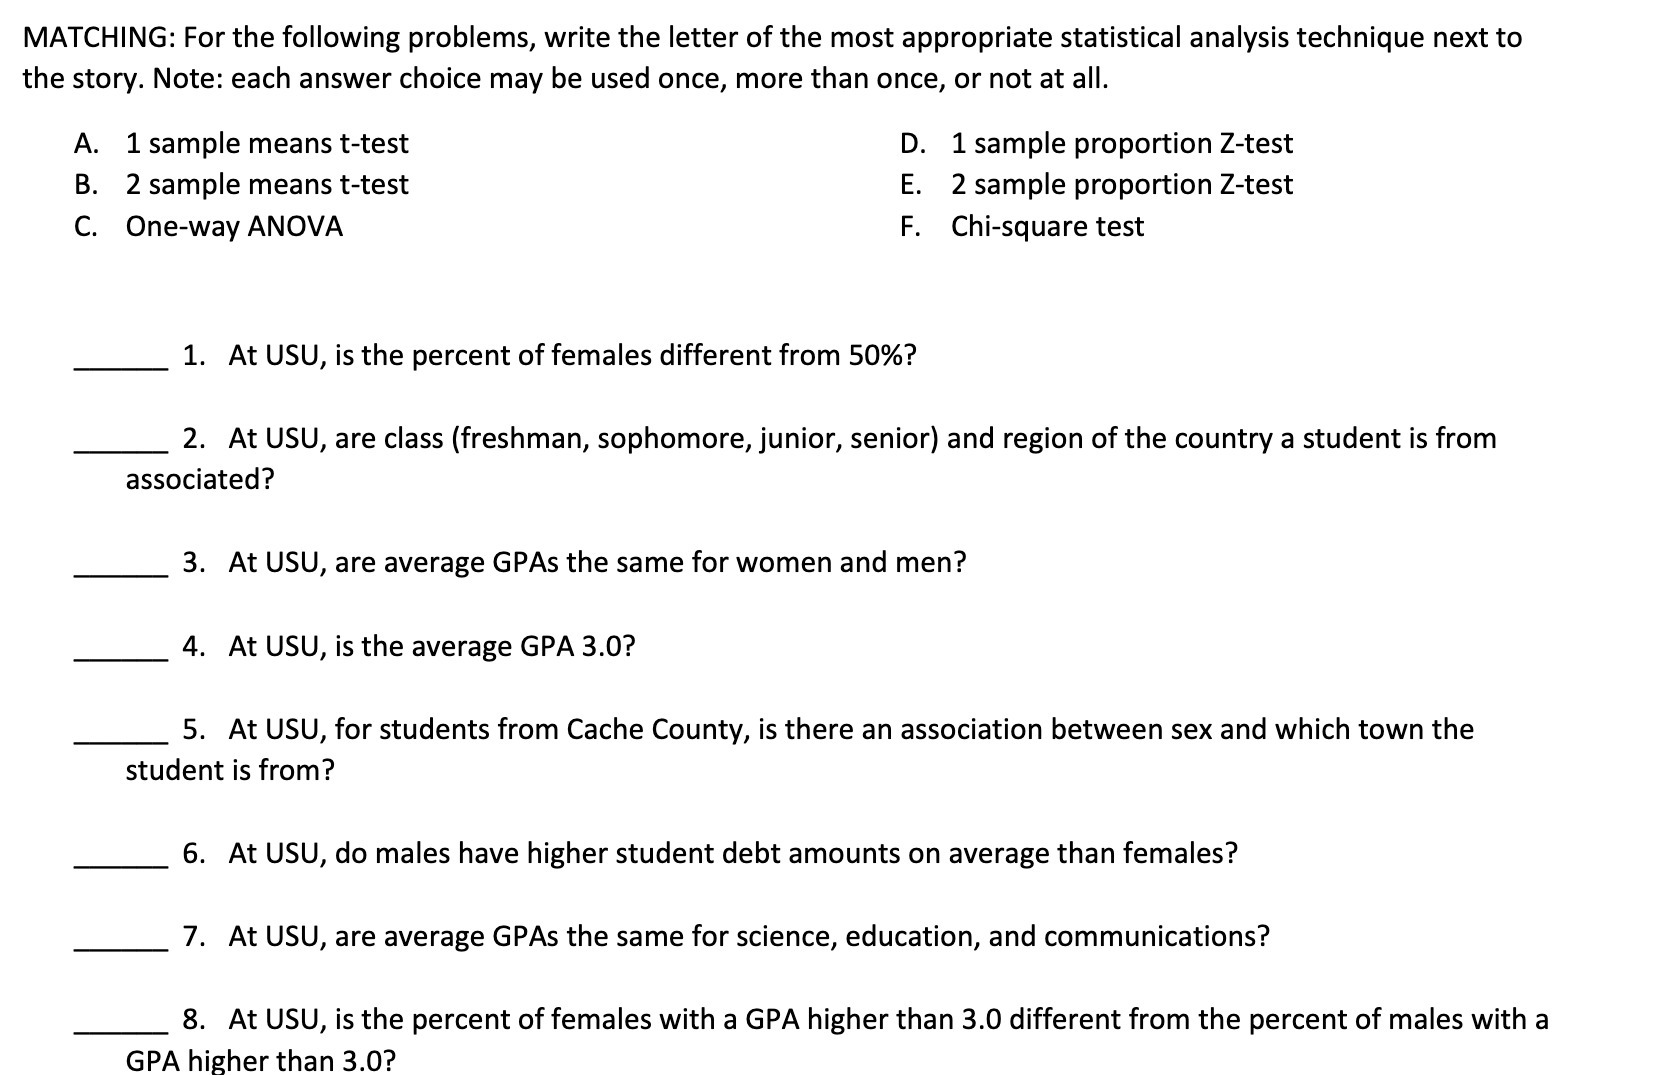
image text in transcribed
MATCHING: For the following problems, write the letter of the most appropriate statistical analysis technique next to the story. Note: each answer choice may be used once, more than once, or not at all. A. 1 sample means ttest D. 1 sample proportion Z-test B. 2 sample means ttest E. 2 sample proportion Ztest C. One-way ANOVA F. Chi-square test 1. At USU, is the percent of females different from 50%? 2. At USU, are class (freshman, sophomore, junior, senior) and region of the country a student is from associated? 3. At USU, are average GPAs the same for women and men? 4. At USU, is the average GPA 3.0? 5. At USU, for students from Cache County, is there an association between sex and which town the student is from? 6. At USU, do males have higher student debt amounts on average than females? 7. At USU, are average GPAs the same for science, education, and communications? 8. At USU, is the percent of females with a GPA higher than 3.0 different from the percent of males with a GPA higher than 3.0

Step by Step Solution

There are 3 Steps involved in it

Step: 1

blur-text-image

Get Instant Access to Expert-Tailored Solutions

See step-by-step solutions with expert insights and AI powered tools for academic success

Step: 2

blur-text-image

Step: 3

blur-text-image

Ace Your Homework with AI

Get the answers you need in no time with our AI-driven, step-by-step assistance

Get Started

Recommended Textbook for

Precalculus Enhanced With Graphing Utilities (Subscription)

Authors: Michael, Michael Sullivan III, Michael III Sullivan, III Sullivan

6th Edition

0321849108, 9780321849106

More Books

Students also viewed these Mathematics questions