Question
Materdor Inc is considering purchase Reya Corp for $250,000.00 (all cash). Complete a 5 year DCF to determine whether the investment will be beneficial for
Materdor Inc is considering purchase Reya Corp for $250,000.00 (all cash). Complete a 5 year DCF to determine whether the investment will be beneficial for Materdor Inc.
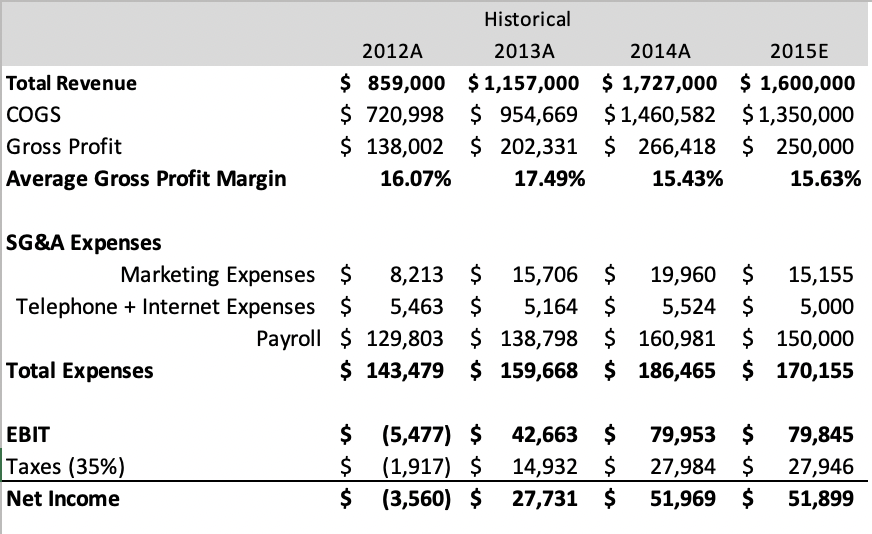
Below are the financials for Reva Corp.
Purchase Price: $250,000.00
Upon acquisition, there will be a decrease in the following costs:
Reduction in marketing expenses by 25%, telephone and internet expenses will decrease to only $120 per month, and long-term labour costs will also decrease by 15%.
Discount rate: 20%
Industry Growth rate: 5%
SG&A totalled approximately 13% (3% for fixed overhead and 10% marginal costs to account for labour)
Payroll consists of 4 employees, 2 of which are salaried, and the other 2 are commission-based consultants who keep 10% of gross revenues each.
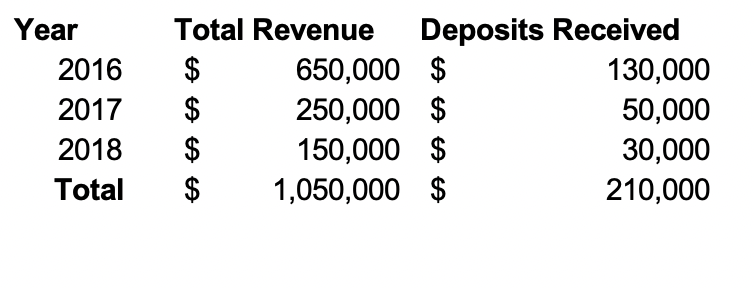
Below are the future sales for Reva Corp however, the deposits received have already been used to pay for COGS therefore they will not transfer to Materdor Inc in cash.
Reva Corp Net Income
Year 2016 2017 2018 Total Total Revenue Deposits Received $ 650,000 $ 130,000 $ 250,000 $ 50,000 $ 150,000 $ 30,000 $ 1,050,000 $ 210,000 Total Revenue COGS Gross Profit Average Gross Profit Margin Historical 2012A 2013A 2014A 2015E $ 859,000 $ 1,157,000 $ 1,727,000 $1,600,000 $ 720,998 $ 954,669 $ 1,460,582 $1,350,000 $ 138,002 $ 202,331 $ 266,418 $ 250,000 16.07% 17.49% 15.43% 15.63% SG&A Expenses Marketing Expenses $ 8,213 $ $ 15,706 $ 19,960 $ 15,155 Telephone + Internet Expenses $ 5,463 $ 5,164 $ 5,524 $ 5,000 Payroll $ 129,803 $ 138,798 $ 160,981 $ 150,000 Total Expenses $ 143,479 $ 159,668 $ 186,465 $ 170,155 EBIT Taxes (35%) Net Income $ (5,477) $ 42,663 $ $ (1,917) $ 14,932 $ $ (3,560) $ 27,731 $ 79,953 $ 27,984 $ 51,969 $ 79,845 27,946 51,899 Year 2016 2017 2018 Total Total Revenue Deposits Received $ 650,000 $ 130,000 $ 250,000 $ 50,000 $ 150,000 $ 30,000 $ 1,050,000 $ 210,000 Total Revenue COGS Gross Profit Average Gross Profit Margin Historical 2012A 2013A 2014A 2015E $ 859,000 $ 1,157,000 $ 1,727,000 $1,600,000 $ 720,998 $ 954,669 $ 1,460,582 $1,350,000 $ 138,002 $ 202,331 $ 266,418 $ 250,000 16.07% 17.49% 15.43% 15.63% SG&A Expenses Marketing Expenses $ 8,213 $ $ 15,706 $ 19,960 $ 15,155 Telephone + Internet Expenses $ 5,463 $ 5,164 $ 5,524 $ 5,000 Payroll $ 129,803 $ 138,798 $ 160,981 $ 150,000 Total Expenses $ 143,479 $ 159,668 $ 186,465 $ 170,155 EBIT Taxes (35%) Net Income $ (5,477) $ 42,663 $ $ (1,917) $ 14,932 $ $ (3,560) $ 27,731 $ 79,953 $ 27,984 $ 51,969 $ 79,845 27,946 51,899Step by Step Solution
There are 3 Steps involved in it
Step: 1
Get Instant Access to Expert-Tailored Solutions
See step-by-step solutions with expert insights and AI powered tools for academic success
Step: 2
Step: 3
Ace Your Homework with AI
Get the answers you need in no time with our AI-driven, step-by-step assistance
Get Started