

Question
Math 219 ONLINE - Midterm 1 - Technology Project (optional 20 points) 1. The attached data are the results of a 1980s study done on
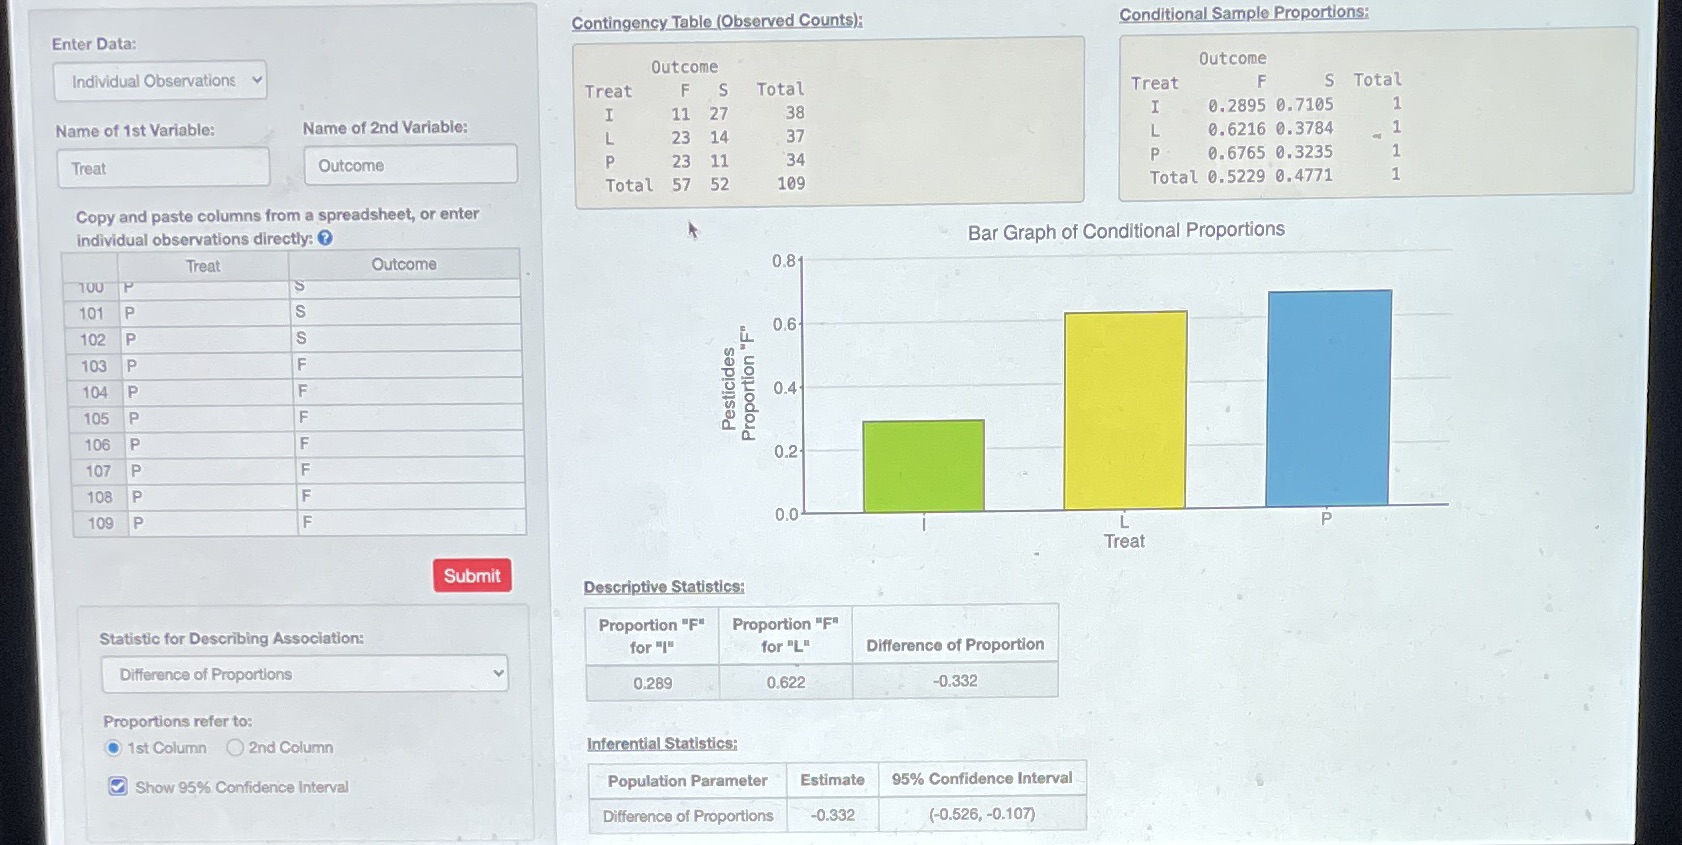
Math 219 ONLINE - Midterm 1 - Technology Project (optional 20 points) 1. The attached data are the results of a 1980s study done on subjects who had experienced clinical depression. Patients were randomly assigned either Imipramine (Imip), Lithium (Li), or a Placebo (Pl) where Imip and Li are active drugs. Like most other medical studies where new, unexplored treatments are evaluated, patients chose themselves to participate in the study by signing a consent form. Patients were followed for 2-4 years to see whether or not they had a recurrence of depression.Answer the following questions after using the data to fill in the table. Assume we randomly select one individual that participated in the study. Show your work, write your answer rounded to the nearest percent, and answer with a sentence. a. If we randomly select a participant what is the probability they were given a Lithium AND Success? b. If we randomly select a participant what is the probability they were given a placebo OR failure? c. Find the probability the individual's treatment was a success given they were assigned to the Lithium treatment group. d. Find the probability the individual's treatment was a success given they were assigned to the Imipramine treatment group. e. Find the probability the individual's treatment was a success given they were assigned to the placebo group. f. Use your answers to c - e to summarize the evidence of which treatments are effective.2.) You are at a fundraiser and are considering entering a raffle. (Hint: make sure you interpret the expected value in context using the law of large numbers). 6% of the tickets will win $200, 15% of tickets will win $40, and the rest of the tickets will win nothing. If the ticket cost $20 find the expected amount of money won or lost if you bought a ticket. Hint: make sure you interpret the expected value in context using the law of large numbers). Directions: Show your work by including screenshots or writing what you entered into the apps. 3. Copy and paste or hand draw a normal distribution for each problem below. Use Grades are the first exam were normally distributed with a mean of 98 points and a standard deviation of 4.7 points. a) What is the probability a student earned 104 points or more?b) How many points did they earn if their z-score is -2.1?c) How many points would you need to score to be the top 5%? 4. 62% of single college students report that it has become harder to date in the last 5 years. If we randomly select 30 single college students calculate the following probabilities. a) Find the probability that exactly 20 say it is harder to date.b) Find the probability that at least 26 say it is harder to date. c) Would it be unusual to find at least 26 students saying it is harder to date.
Step by Step Solution
There are 3 Steps involved in it
Step: 1

Get Instant Access to Expert-Tailored Solutions
See step-by-step solutions with expert insights and AI powered tools for academic success
Step: 2

Step: 3
Ace Your Homework with AI
Get the answers you need in no time with our AI-driven, step-by-step assistance
Get Started
Elementary Algebra
Authors: Charles P McKeague
2nd Edition
1483263819, 9781483263816