Question
Math 324 lab 3 The purpose of the lab is to compare the probability distributions of a Binomial random variable (r.v.) with a very large
Math 324 lab 3
The purpose of the lab is to compare the probability distributions of a Binomial random variable (r.v.) with a very large n and very small probability of success p and Poisson r.v. with expectation mu = n*p using both probability formulas and statistical methods. (The probability theory says that those distributions should be very close when n is very large and p is very small and n*p
The instructions are for Excel and produce the output in the attached lab3 prototype. You may use instead (and report) any program of your choice.
1. Chose your own large n and small p so that n*p
2. Label "x" in C1 and put numbers 0 through 10 in C2:C12.
3. Label D1: "b(x)" and E1: "B(x)". Put values of probability mass function and cumulative distribution functions in, respectively, D2:D12 and E2:E12. To do that, click on D2 and click on the function button on the formula bar. In the function menu choose category "Statistical". In the list of statistical functions, scroll down to "Binomdist" and click. In the dialogue box, put C2 in the x line, your chosen n and p in the next lines and in the "Cumulative" line put "false" (without quotes). Hit "Enter" - a formula will attach to D2 that will compute b(0) and display it in D2. "Drag" the formula down to D12: click on D2, put the cursor at the bottom-right corner of D2 (a cross will appear there), press and roll the mouse down to D12.
Now, repeat the same procedure in E2:E12 using "Binomdist" function with the same parameters but put "true" in the "Cumulative" line.
After that use the same method to produce columns F1:F12 and G1:G12: label F1: poi(x) and G1: Poi(x) and use the "Poissondist" function in place of the "Binomdist" to fill up ranges F2:F12 and G2:G12.
4. Use the Descriptive Statistics tool in the Data Analysis menu to produce reports on both Binomial and Poisson data in columns A and B and put them side by side in columns, say, H, I, J and K.
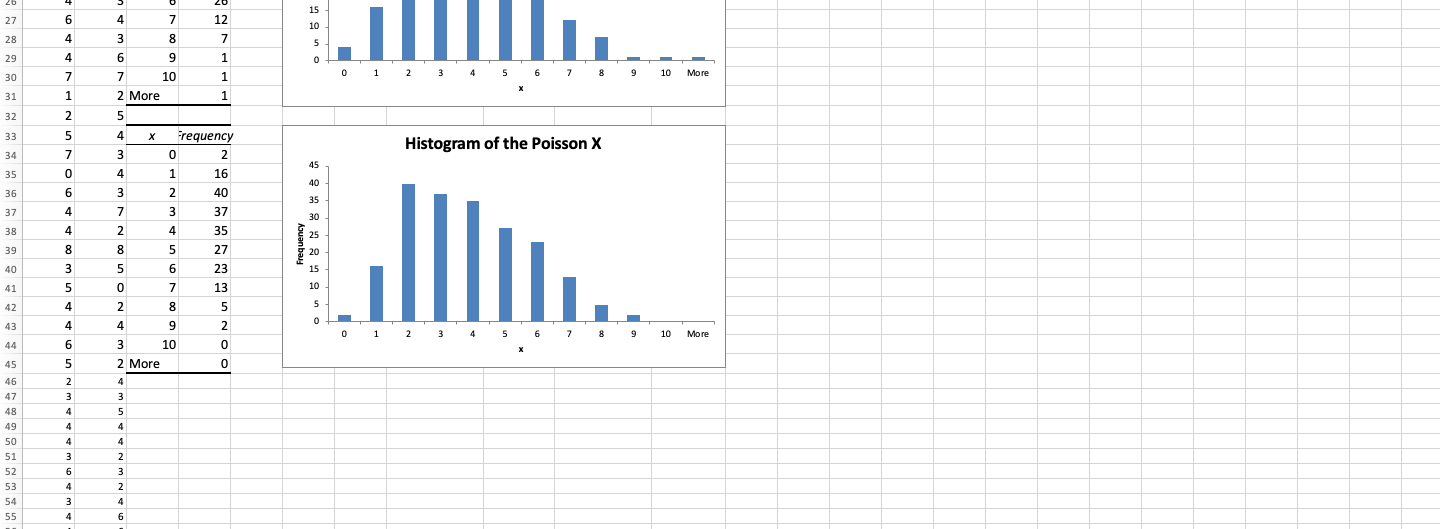
5. Use the Histogram tool in the Data Analysis to produce histograms of the data in A and B columns. Use the data in C1:C12 as your bin numbers. Edit the histograms to make them self-explanatory: the titles and the x-axis titles should reflect the nature of the data, remove the legend, etc.
6. Open a text box (using the Text Box "A" button from the Insert mode) somewhere in the worksheet and report there your name, section #, "Lab3" and both seed ##. In your report there:
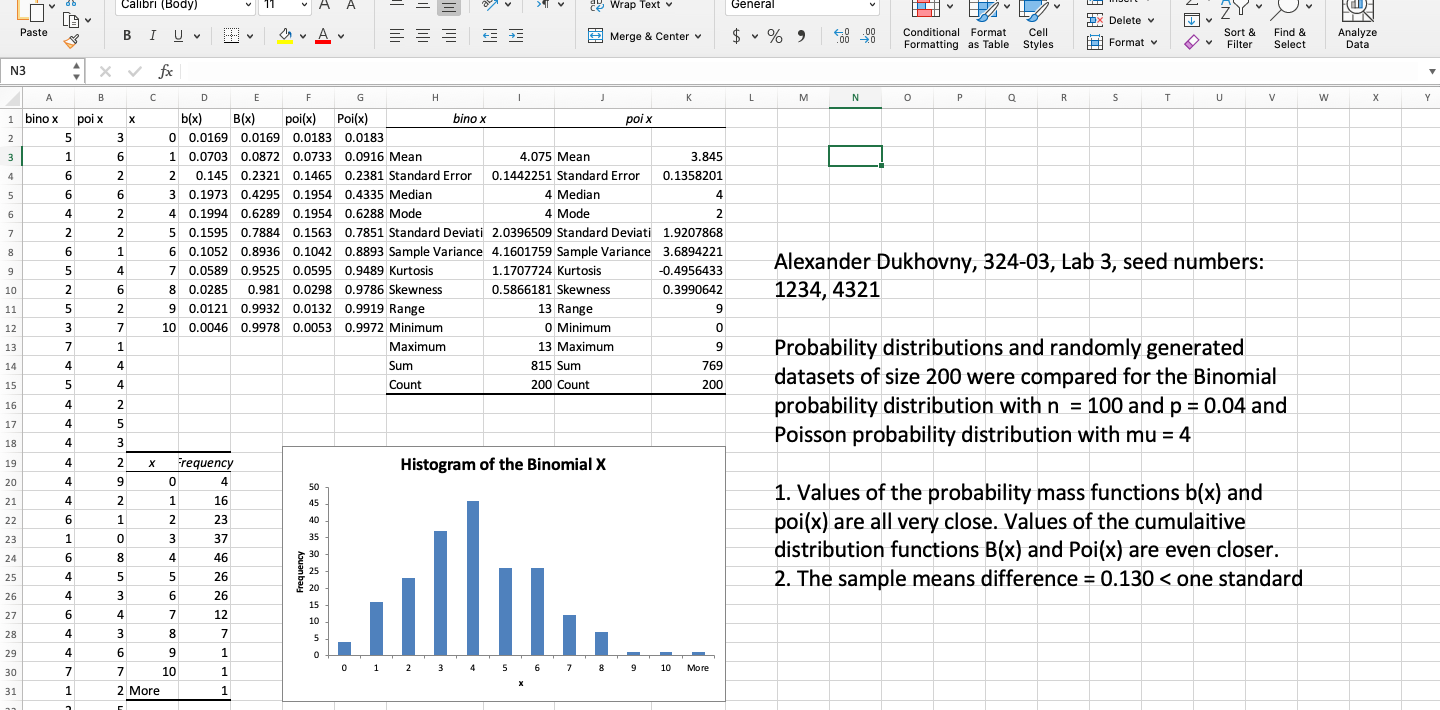
Compare the values of the probability mass functions and cumulative distribution functions for both distributions.
Report on how significant the sample means difference is by dividing it by the standard error of the Binomial, and whether the ratio of the sample variances differs significantly from 1.
Compare the histograms - shapes and outliers.
Report whether your study supports using Poisson distribution as an approximation for the Binomial one when n is very large, p is very small and mu = np
Sample:


Step by Step Solution
There are 3 Steps involved in it
Step: 1

Get Instant Access to Expert-Tailored Solutions
See step-by-step solutions with expert insights and AI powered tools for academic success
Step: 2

Step: 3

Ace Your Homework with AI
Get the answers you need in no time with our AI-driven, step-by-step assistance
Get Started


