Answered step by step
Verified Expert Solution
Link Copied!

Question

1 Approved Answer

Math134 F21 Marques Woodward & | 09/17/21 8:24 PM Test: Exam(1) Question 25 This Test: 80 pts possible Submit Test The following data represent the
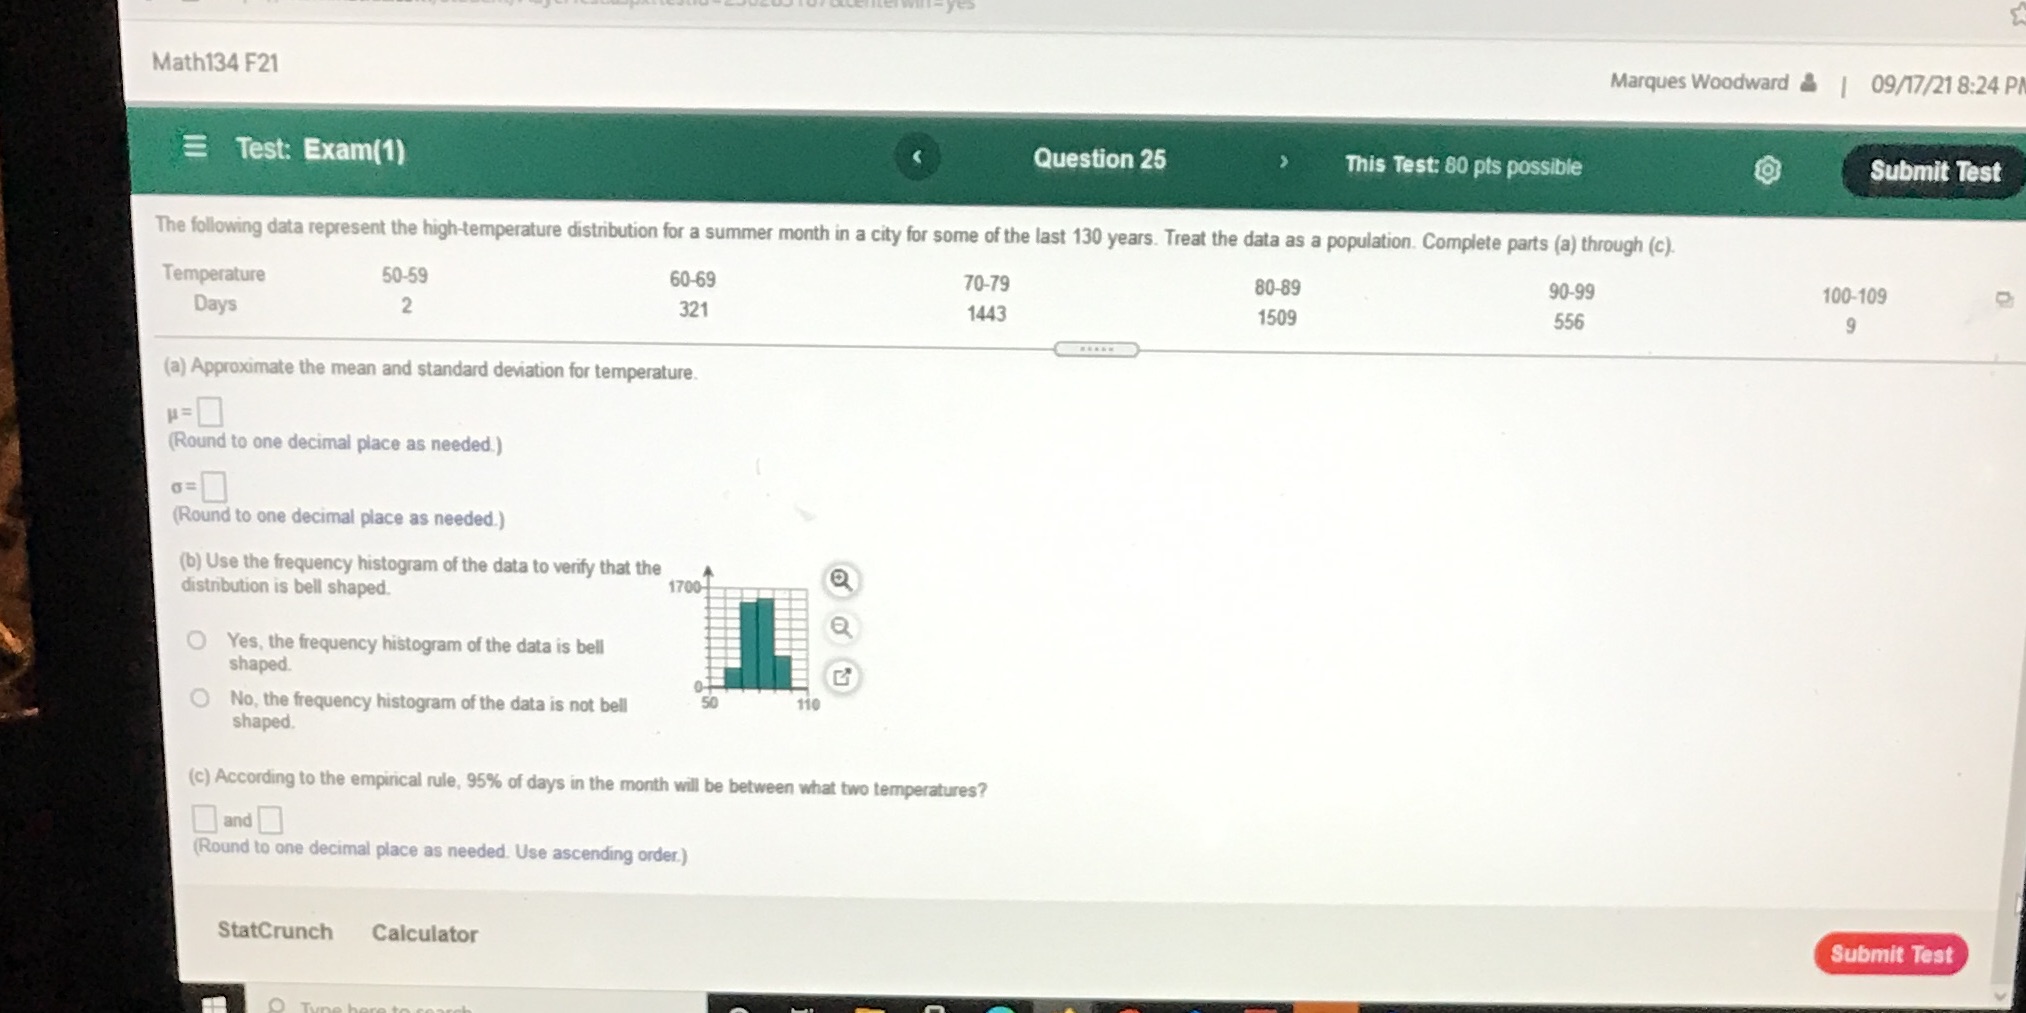
image text in transcribed
Math134 F21 Marques Woodward & | 09/17/21 8:24 PM Test: Exam(1) Question 25 This Test: 80 pts possible Submit Test The following data represent the high-temperature distribution for a summer month in a city for some of the last 130 years. Treat the data as a population. Complete parts (a) through (c). Temperature 50-59 60-69 70-79 80-89 90-99 100-109 Days 2 321 1443 1509 556 9 (a) Approximate the mean and standard deviation for temperature. (Round to one decimal place as needed.) (Round to one decimal place as needed.) (b) Use the frequency histogram of the data to verify that the distribution is bell shaped. 1700- Yes, the frequency histogram of the data is bell shaped. No, the frequency histogram of the data is not bell 110 shaped. (c) According to the empirical rule, 95% of days in the month will be between what two temperatures? and (Round to one decimal place as needed. Use ascending order.) StatCrunch Calculator Submit Test

Step by Step Solution

There are 3 Steps involved in it

Step: 1

blur-text-image

Get Instant Access to Expert-Tailored Solutions

See step-by-step solutions with expert insights and AI powered tools for academic success

Step: 2

blur-text-image_2

Step: 3

blur-text-image_3

Ace Your Homework with AI

Get the answers you need in no time with our AI-driven, step-by-step assistance

Get Started

Recommended Textbook for

How To Prove It A Structured Approach

Authors: Daniel J Velleman

2nd Edition

0511159439, 9780511159435

More Books

Students also viewed these Mathematics questions

Question

Discuss the relationship between ARL and type I and II errors.

Answered: 1 week ago