Answered step by step
Verified Expert Solution
Question
1 Approved Answer
MATLAB 2D Plotting Problem Create a 4x4 matrix containing random integer values between 3 and 12. Display matrix and the sum of all its elements.
MATLAB 2D Plotting Problem
Create a 4x4 matrix containing random integer values between 3 and 12. Display matrix and the sum of all its elements. Replace the values of the 22 matrix in the center of the 44 with zeros. Display the modified 44 matrix.
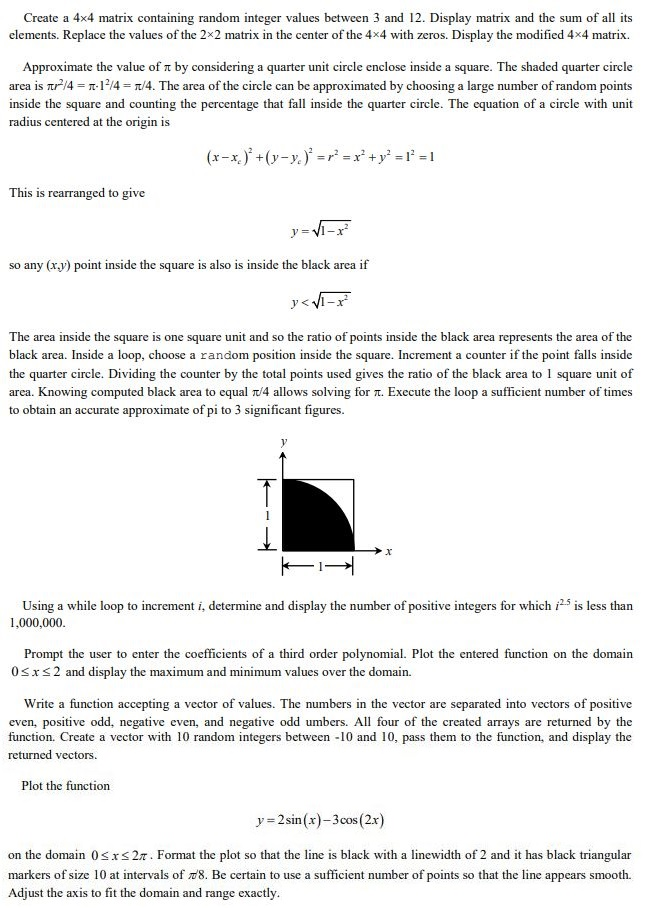
Create a 4x4 matrix containing random integer values between 3 and 12. Display matrix and the sum of all its elements. Replace the values of the 2x2 matrix in the center of the 4x4 with zeros. Display the modified 4x4 matrix Approximate the value of by considering a quarter unit circle enclose inside a square. The shaded quarter circle area is ,2/4-. 12/4-n4. The area of the circle can be approximated by choosing a large number of random points inside the square and counting the percentage that fall inside the quarter circle. The equation of a circle with unit radius centered at the origin is This is rearranged to give so any (x.y) point inside the square is also is inside the black area if The area inside the square is one square unit and so the ratio of points inside the black area represents the area of the black area. Inside a loop, choose a random position inside the square. Increment a counter if the point falls inside the quarter circle. Dividing the counter by the total points used gives the ratio of the black area to 1 square unit of area. Knowing computed black area to equal /4 allows solving for T. Execute the loop a sufficient number of times to obtain an accurate approximate of pi to 3 significant figures. Using a while loop to increment i, determine and display the number of positive integers for which i25 is less than 1,000,000 Prompt the user to enter the coefficients of a third order polynomial. Plot the entered function on the domain 0SxS2 and display the maximum and minimum values over the domain. Write a function accepting a vector of values. The numbers in the vector are separated into vectors of positive even, positive odd, negative even, and negative odd umbers. All four of the created arrays are returned by the function. Create a vector with 10 random integers between 10 and 10, pass them to the function, and display the returned vectors. Plot the function y-2sin (x)-3cos(21) on the domain 0sxs 2T. Format the plot so that the line is black with a linewidth of 2 and it has black triangular markers of size 10 at intervals of 8. Be certain to use a sufficient number of points so that the line appears smooth. Adjust the axis to fit the domain and range exactly
Step by Step Solution
There are 3 Steps involved in it
Step: 1
Get Instant Access to Expert-Tailored Solutions
See step-by-step solutions with expert insights and AI powered tools for academic success
Step: 2
Step: 3
Ace Your Homework with AI
Get the answers you need in no time with our AI-driven, step-by-step assistance
Get Started