Answered step by step
Verified Expert Solution
Question
1 Approved Answer
MATLAB 4. Write a function named thickLines.m, with function declaration 1 function thickLines (H) The purpose of the function is to increase the value of
MATLAB
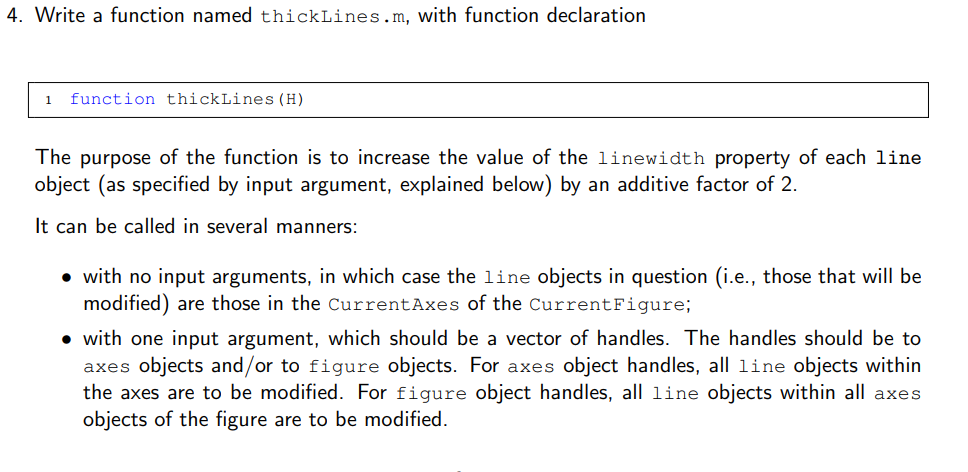
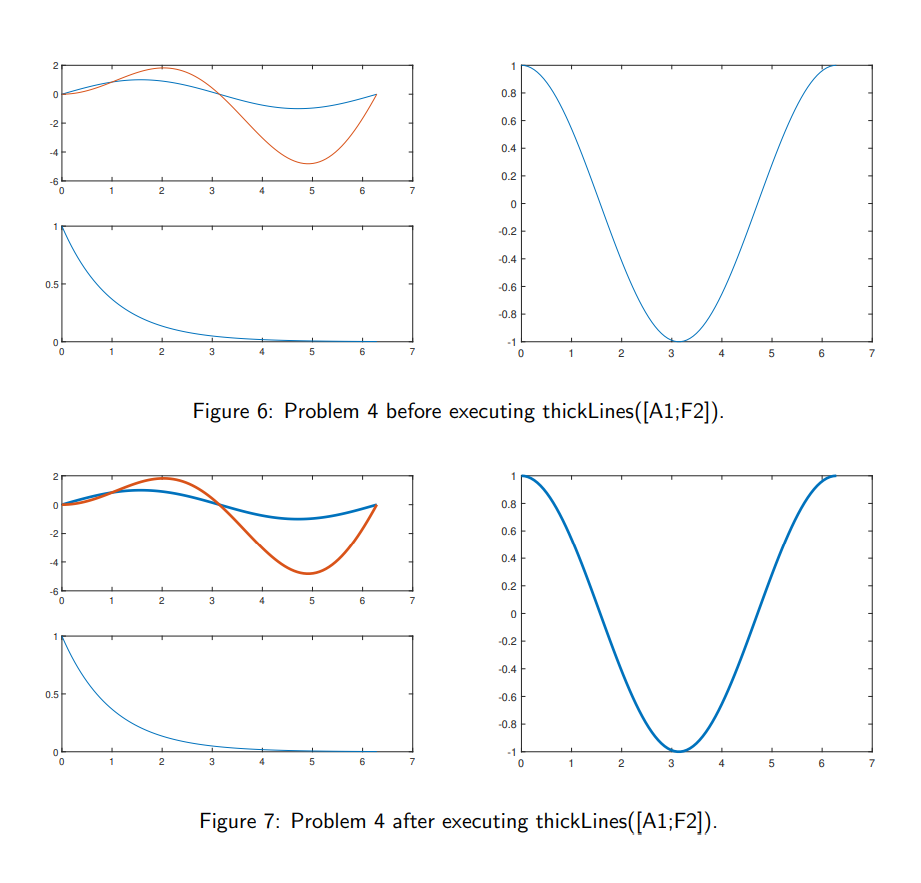
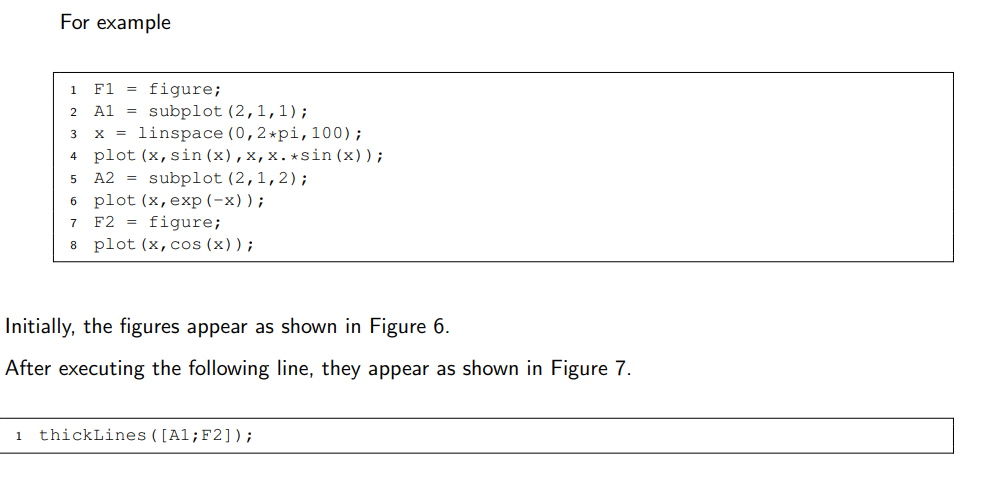
4. Write a function named thickLines.m, with function declaration 1 function thickLines (H) The purpose of the function is to increase the value of the linewidth property of each line object (as specified by input argument, explained below) by an additive factor of 2. It can be called in several manners: with no input arguments, in which case the line objects in question (i.e., those that will be modified) are those in the CurrentAxes of the CurrentFigure; with one input argument, which should be a vector of handles. The handles should be to axes objects and/or to figure objects. For axes object handles, all line objects within the axes are to be modified. For figure object handles, all line objects within all axes objects of the figure are to be modified. Nu 1 0 0.8 -2 0.6 -4 0.4 0.2 -6 1 2 0 3 4 5 6 7 0 -0.2 -0.4 0.5 -0.6 -0.8 od 1 2 3 5 2 3 4 5 6 7 Figure 6: Problem 4 before executing thickLines([A1;F2]). 1 0 0.8 -2 0.6 -4 0.4 0.2 -6 2 5 7 0 -0.2 -0.4 0.5 -0.6 -0.8 op 1 2 3 5 7 2 3 4 5 6 7 Figure 7: Problem 4 after executing thickLines([A1;F2]). For example 1 2 3 F1 = figure; A1 = subplot (2,1,1); x = linspace (0,2*pi, 100); 4 plot (x, sin(x), X,X.*sin(x)); A2 = subplot (2,1,2); 6 plot (x, exp(-x)); F2 = figure; 8 plot (x,cos (x)); 5 7 Initially, the figures appear as shown in Figure 6. After executing the following line, they appear as shown in Figure 7. 1 thickLines ([A1;F2])Step by Step Solution
There are 3 Steps involved in it
Step: 1
Get Instant Access to Expert-Tailored Solutions
See step-by-step solutions with expert insights and AI powered tools for academic success
Step: 2
Step: 3
Ace Your Homework with AI
Get the answers you need in no time with our AI-driven, step-by-step assistance
Get Started