

Question
MATLAB ASSIGMENT: Starting with the code in [ https://drive.google.com/open?id=1cYOgxjPhRVi-eWVNi-8WqDI5GW5h8HK1 ] generate the following plot. Use 100,000 random normal numbers with a standard deviation of 5
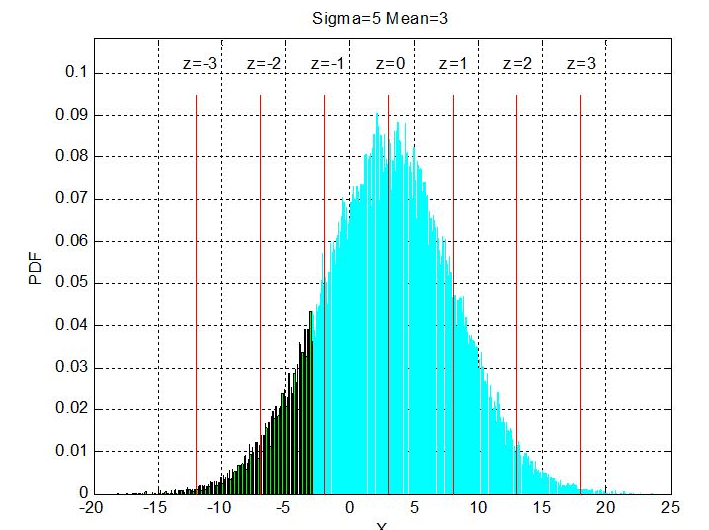
MATLAB ASSIGMENT: Starting with the code in [ https://drive.google.com/open?id=1cYOgxjPhRVi-eWVNi-8WqDI5GW5h8HK1 ] generate the following plot. Use 100,000 random normal numbers with a standard deviation of 5 and a mean of three. Plot red vertical lines for sigma=-3:3, and label the z scores as shown. Call this mfile DistributionHomework_LastName.m.
Step by Step Solution
There are 3 Steps involved in it
Step: 1

Get Instant Access to Expert-Tailored Solutions
See step-by-step solutions with expert insights and AI powered tools for academic success
Step: 2

Step: 3
Ace Your Homework with AI
Get the answers you need in no time with our AI-driven, step-by-step assistance
Get Started
SQL Server T-SQL Recipes
Authors: David Dye, Jason Brimhall
4th Edition
1484200616, 9781484200612